Methods
Movie barcodes as method
Computational analysis of film colour is resource-intensive and so the workflow comprises two stages to make the process manageable:
-
sampling: frames are selected from a film based on their timecode (e.g., every n-th frame or n frames per second) or their representativeness of a sequence of frames based on a segmentation of the film into coherent scenes.
-
data reduction: the pixel data in each frame is reduced to a single set of values that are representative of the whole image, and which are usually based on either the average or dominant colour of the pixels, or the representativeness of an exemplar colour based on cluster analysis.
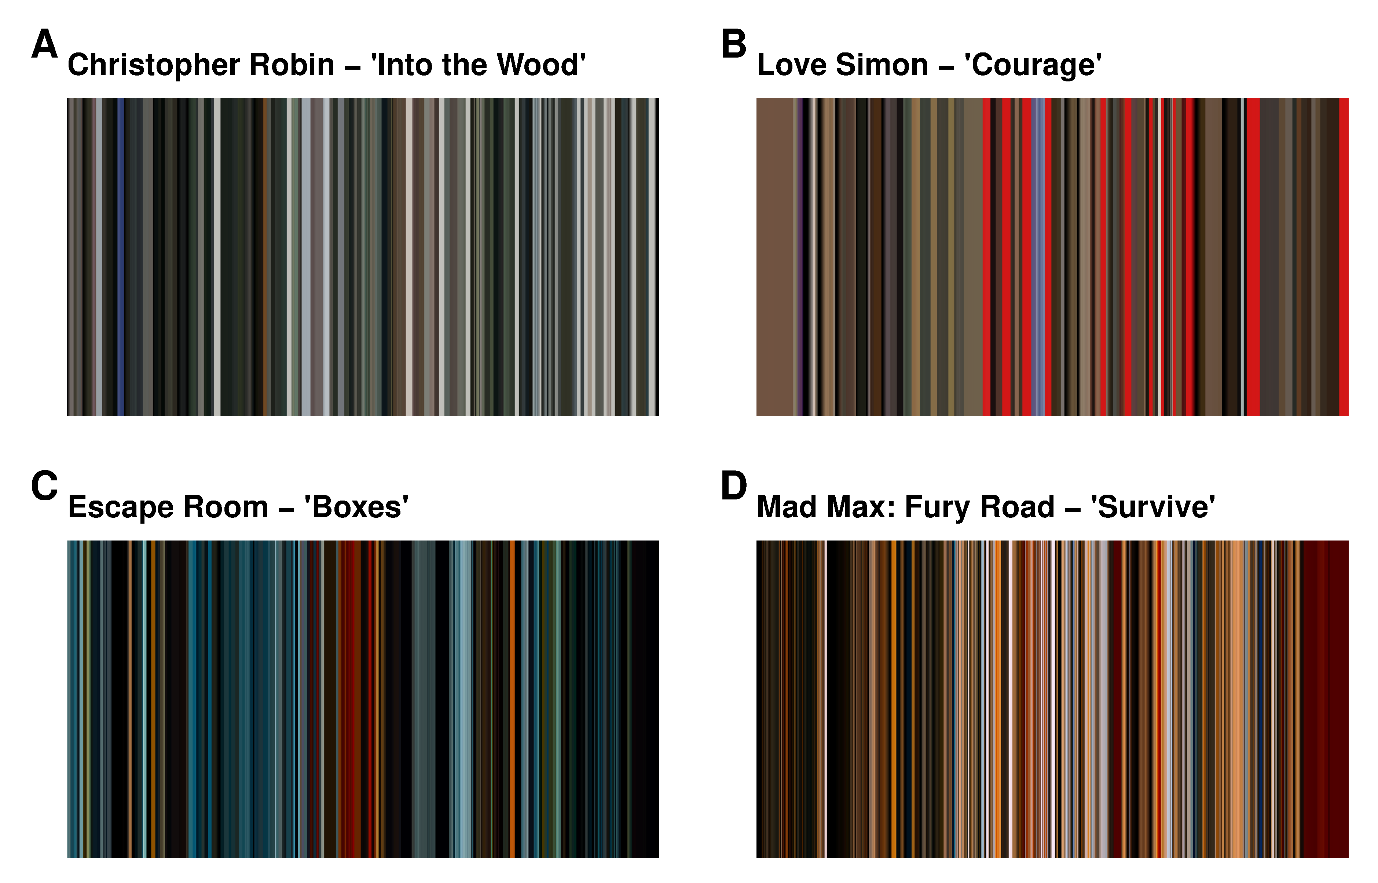
A movie barcode is one way of sampling and reducing the colour data in a film and is the most commonly used method of analysing and visualising colour in cinema ( ; ). Isola et al. ( ) used movie barcodes to segment the structure of films based on colour that correlated well with DVD chapters. Burghardt et al. ( ) and Burghardt, Kao, and Walkowski ( ) explored the relationship between colour, dialogue, and character in motion pictures using movie barcodes as a fingerprint of the chromatic structure of a film. Hohman et al. ( ) explored the relationship between colour, dialogue, and emotion in Game of Thrones using a method similar to movie barcodes to visualise the structure of the show’s episodes. Bhardwaj ( ) employed barcodes to explore the macro-structure of colour in anime films.
The sampling and reduction workflow of computational approaches inevitably results in a loss of data that imposes limitations on any analysis. A significant limitation of using movie barcodes is that they use only a small proportion of the available data. For example, a 100-minute feature length film with a frame rate of 24 frames per second has 144000 frames, which means that selecting 1000 frames for inclusion in a barcode uses only 0.7% of the available data. There are additional limitations to using movie barcodes as a research method. Halter et al. ( ) argue the use of movie barcodes beyond distant watching is limited due to a loss of granularity through the averaging process. Kuhn et al. ( ) note that while visualisation methods such as movie barcodes are informative, they lack explanatory power in themselves. It is therefore necessary to extract data from the smoothed barcodes that can be further processed in order to draw conclusions about colour in film trailers.
Sample
The sample used in this study comprises 173 trailers nominated for a Golden Trailer Award (GTA) in nine genres between 2016 and 2019, inclusive. The nine genres are action, animation/family, comedy, documentary, drama, fantasy/adventure, horror, romance, and thriller (Golden Trailer Awards 2020). The GTAs also have similar categories for non-US films designated as foreign action, foreign horror, etc., but these are not included in the present study. The sample only includes trailers nominated in the cinematic categories and does not include trailers produced for television or online distribution, though it does include a handful of trailers produced for ComicCon that were nominated in cinematic categories. The use of genres in this paper does not therefore reflect Platonic conceptualisations of a specific genre – no such conceptualisation being possible, in any case (see : 24-27). Nor are these categories based on the genre of the film promoted by a trailer. Rather they are based on the ways in which the producers of the trailers themselves consciously positioned their work within the marketplace by submitting a trailer for an award.
Trailers receiving multiple nominations are not included in the sample, ruling out three trailers nominated in more than one category (Long Shot – ‘This Guy’, A Star is Born – ‘Not Alone’, and Us – ‘International Trailer’). One trailer (Adrift – ‘Bon Voyage’) was nominated in the romance category in consecutive years and is included in the sample once only.
The trailers were downloaded from YouTube, the Clios website, or the websites of the trailer production companies as mp4 files and edited to remove MPAA rating tag screens. Some trailers are topped and tailed by additional promotional material either announcing the trailer itself, additional social media information not part of the cinematic release, and/or advertising the YouTube channel hosting the trailer and this was also removed prior to analysis. I cropped each trailer to remove letterbox blanking bars in order to ensure the colour analyses in the study were not distorted by having large parts of the frame dominated by a colour unrelated to the trailers themselves.
Generating the barcodes
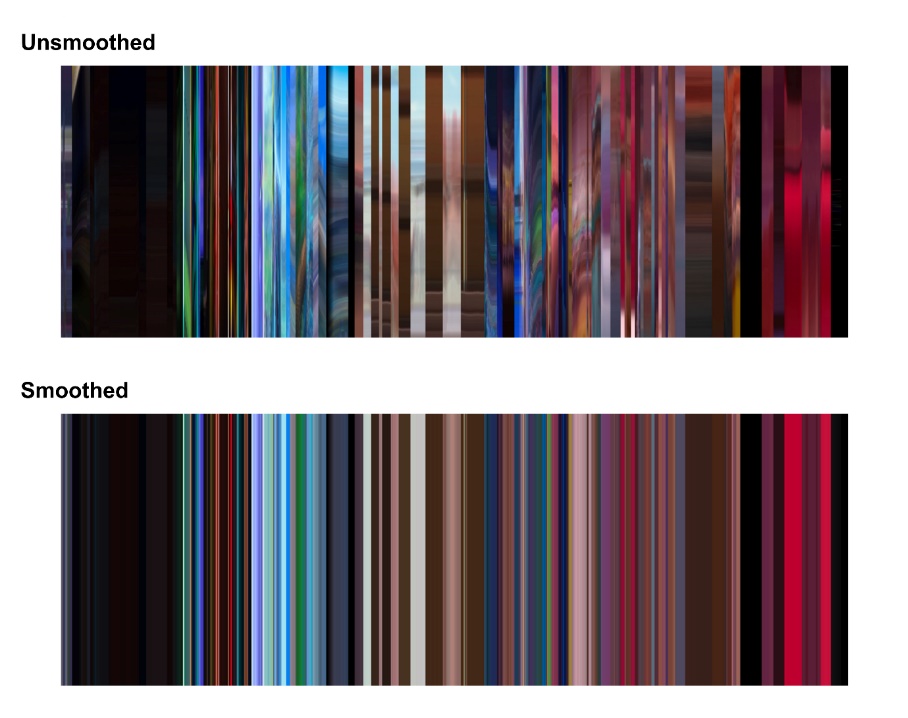
The smoothed barcode of each trailer was generated using Melvyn Laïly’s Movie Barcode Generator (v.1.6; ). This software takes an input video file and extracts 1000 individual frames which are then reduced to a single pixel’s width and stacked together, with each column representing a frame from the film. The Movie Barcode Generator generates unsmoothed and smoothed barcodes from a video file, with the bars in the latter the average colour of the bars in the original version. The barcodes of the trailer Ralph Breaks the Internet: Wreck It Ralph 2 – ‘Wired Refresh’ in are examples of the outputs of this process. The complete set of 173 smoothed barcodes used in this study is available online under a Creative Commons Attribution 4.0 International License ( ).
Using the smoothed barcode of each trailer means that every row of the image has the same information and so we can pick any individual row of pixels in order to analyse the colour information contained within the barcode. This improves the computational efficiency of the analysis while accurately reflecting the colour information available in the smoothed barcode. I extracted the 100th row of pixels of each smoothed barcode and concatenated the data for each trailer in a genre to create a single dataset for each genre used in the subsequent analyses.
Some of the limitations of using movie barcodes as a method are mitigated in this study. The sample size problem is reduced because I am working with trailers with numbers of frames that range from 1176 (Our Souls at Night – ‘Sunday Love Teaser’, 49.0 seconds at 24 fps) to 4702 frames (Fantastic Beasts: Crimes of Grindlewald – ‘Rare ComicCon,’ 195.9 seconds at 23.976 fps). The barcodes used in this study therefore represent between 85.0% and 21.3% of the frames in a trailer, with a median of 29.0% frames sampled from each film. The loss of data resulting from the sample-and-reduce workflow is not an issue because I am interested only in variations in the dominant colours between genres.
HSL colour data
To compare the different colours each genre I converted the RGB image of each barcode to the HSL colour space ( ) using the RGB2HSL() function from the imager package ( ) for the statistical programming language R (v. 4.0.3; ), with the saturation and lightness channels multiplied by 100 to express them as percentages.
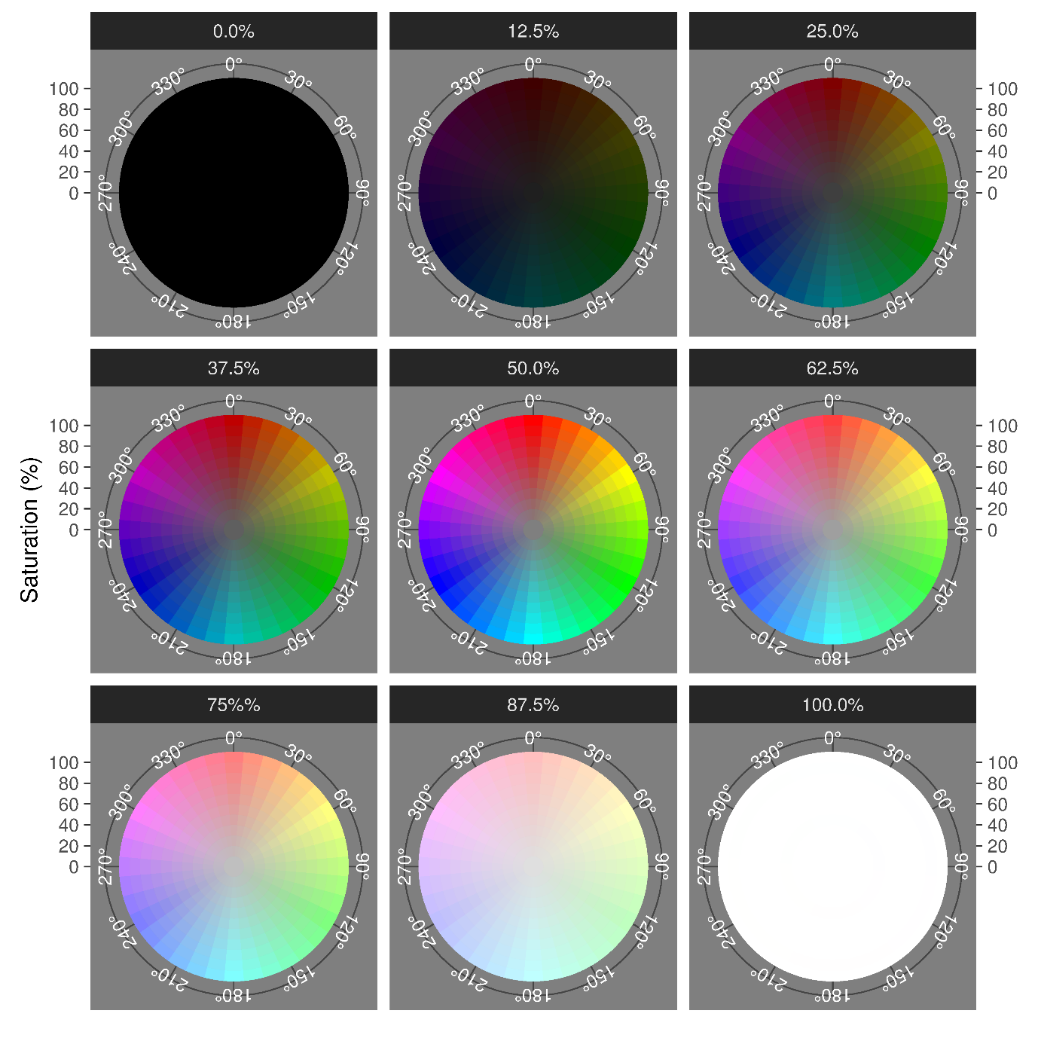
The HSL colour space ( ) is defined by three colour-making attributes:
-
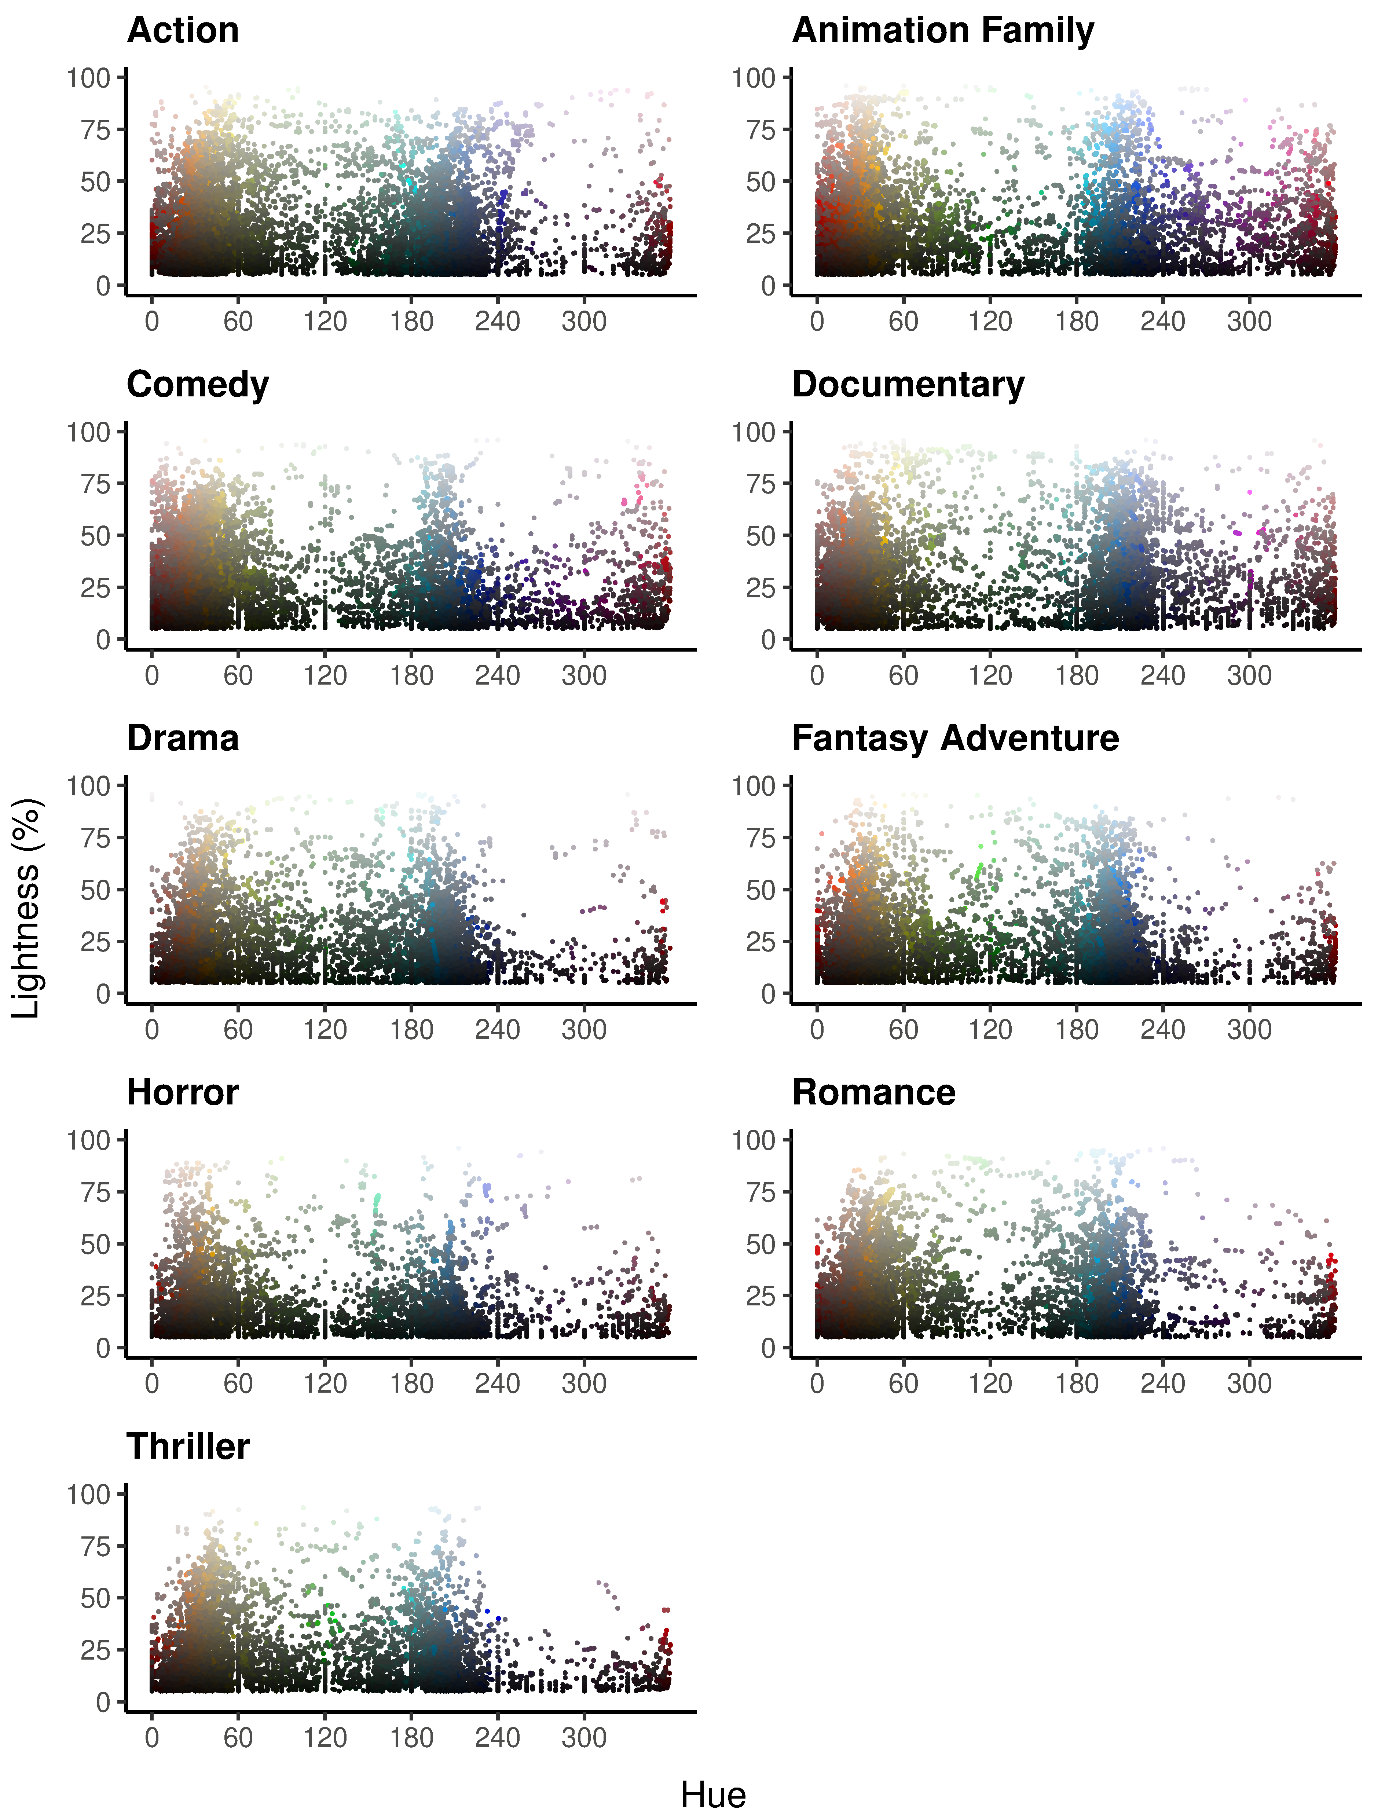
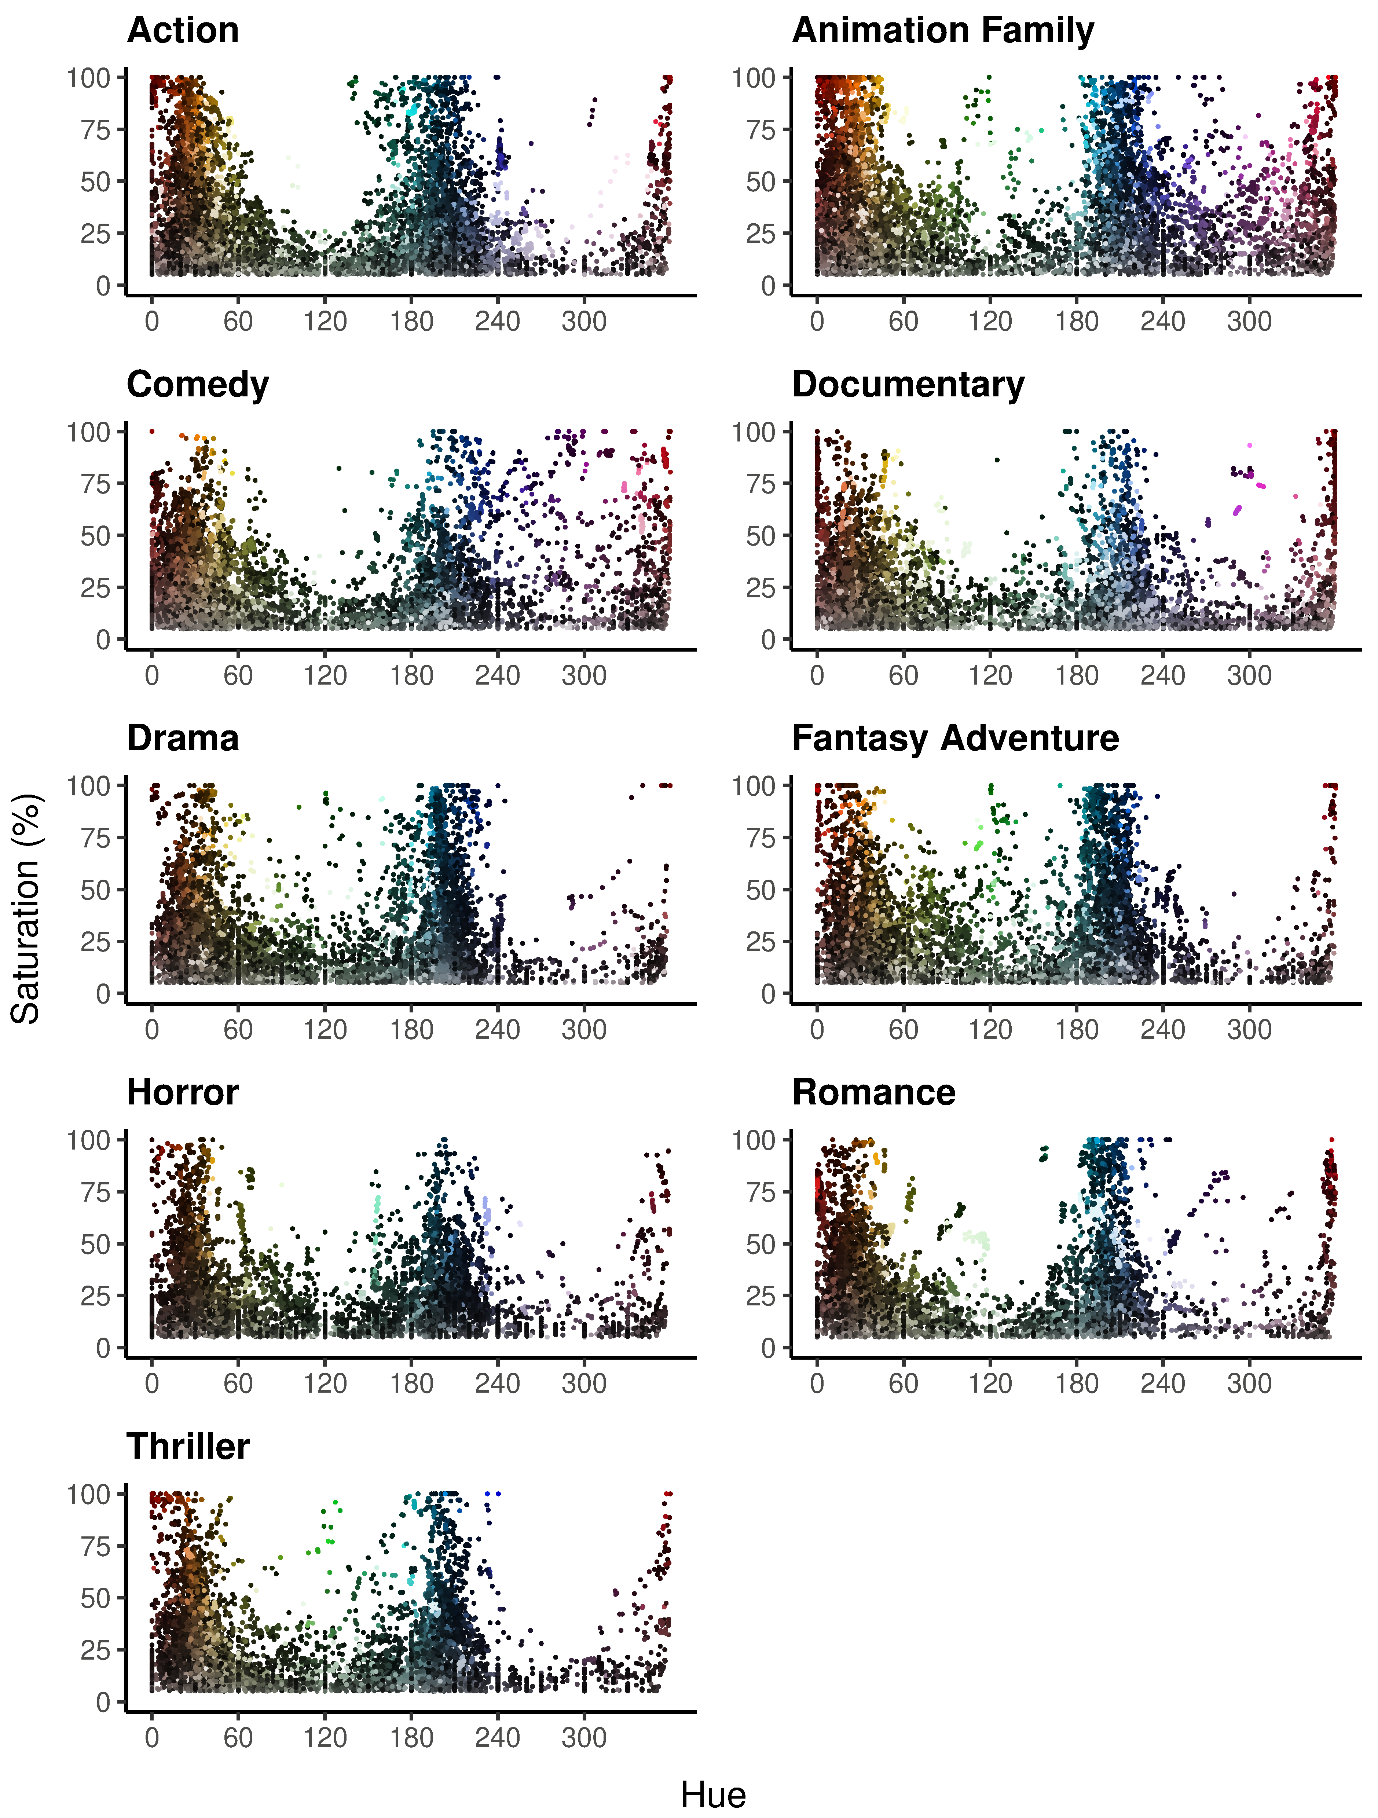
Hue: the natural colour expressed as a degree on the colour wheel, where red = 0°, green = 120°, and blue = 240°.
-
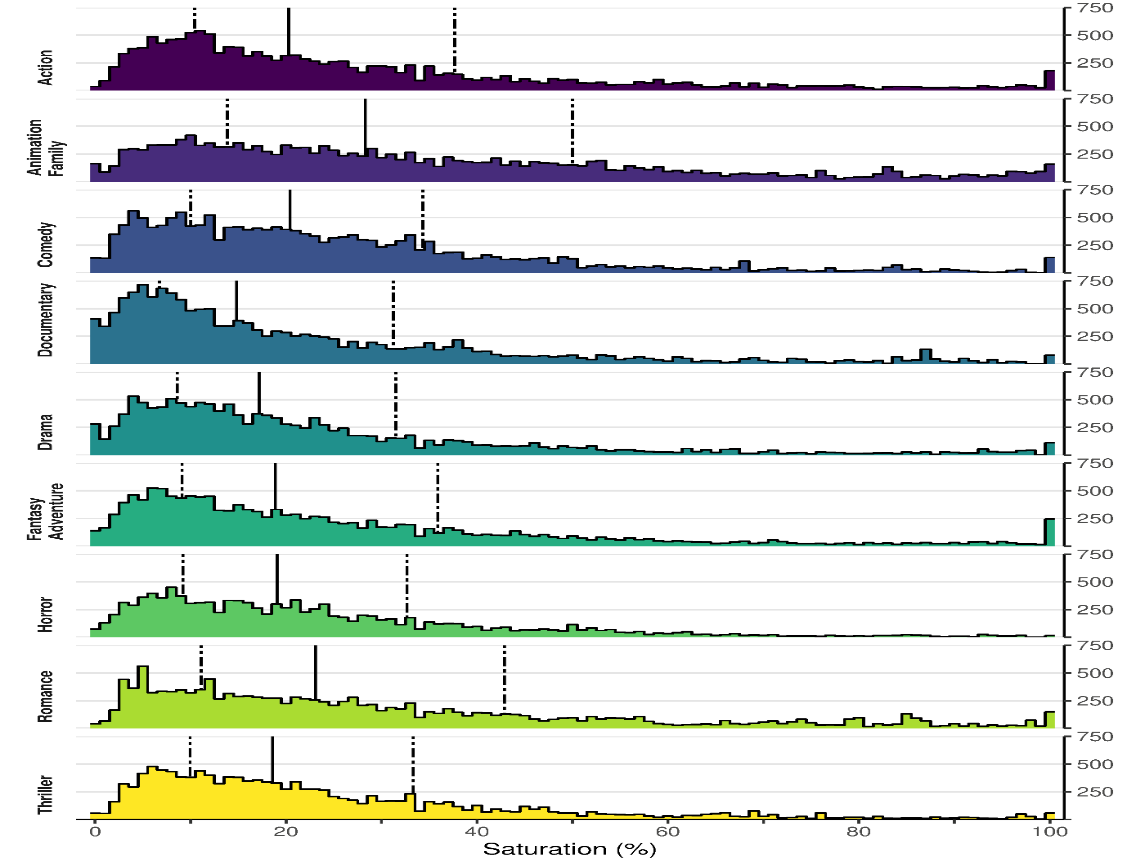
Saturation: the purity of the colour expressed as a percentage and measured as its distance from grey (S = 0%). Pure hues occurs when S = 100%.
-
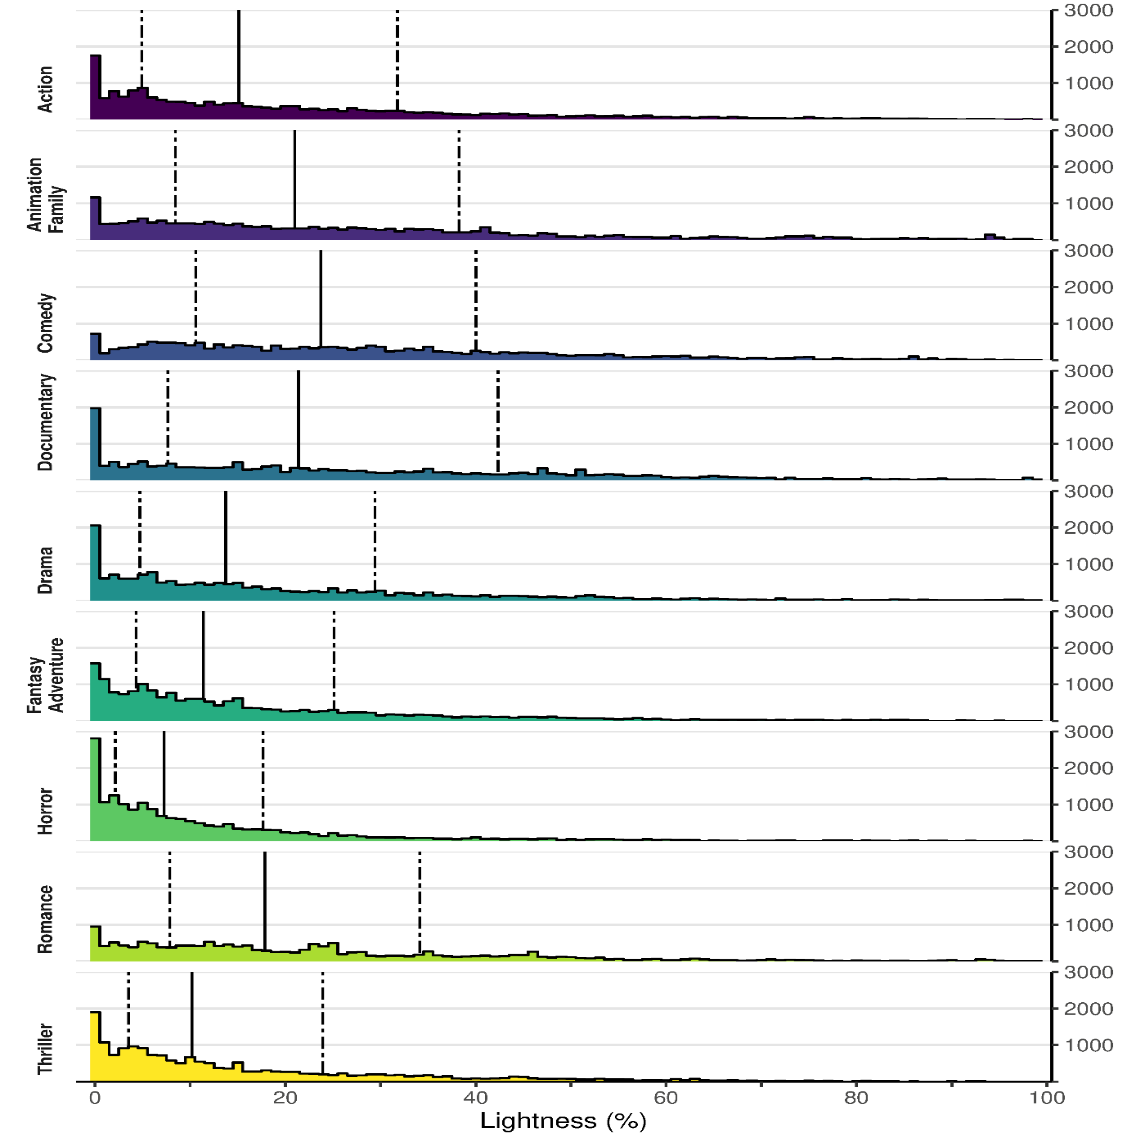
Lightness: the brightness of a colour relative to the brightness of a similarly illuminated white expressed as a percentage. Full colour occurs when L = 50%, with colours becoming darker as and lighter as
In HSL colour space, hue and saturation values are arbitrary for black and white, which depend solely on their lightness value, where L = 0% is black and L = 100% is white. Hue values are arbitrary for grey, which describes all colours with a saturation of 0% and where 0% < L < 100%. The HSL colour space is not perceptually uniform but it is easy to interpret the values of H, S, and L, unlike the L*a*b* colour space which is preferred for calculations because of its perceptual uniformity (see below) but which has attributes that are harder to interpret.
In the HSL colour space, black and white are defined only by their lightness and have arbitrary saturation values. To limit the data set to meaningful saturation attributes I filtered black and white pixels using an expanded definition of each to account for the fact that it is not possible to visually distinguish between colours that are close to black or white. For example, I cannot perceive any meaningful distinction between black, with L = 0% and arbitrary H and S values, and very dark grey, where S = 0%, L = 1%, and H is arbitrary. The definitions used here are:
-
Black: a lightness value less than or equal to 5% (L ≤ 5%)
-
White: a lightness value greater than or equal to 96% (L ≥ 96%)
Filtering the data in this way leaves us with only those saturation values that are meaningful.
In order to focus attention on the hues of the pixels, the generic data sets were further filtered so that all grey pixels were removed. Again, I used an expanded definition of grey to reflect the difficulty in visually distinguishing between grey and colours close to grey:
-
Grey: a saturation value of less than or equal to 5% (S ≤ 5%) and a lightness that is not already classed as black or white (5% < L < 96%).
The remaining colours are therefore defined by their hue, S > 5%, and 5% < L < 96%. This removes all pixels with arbitrary H values that would otherwise lead us to misinterpret the distribution of hues in a genre. It also removes datapoints with hues that are difficult to interpret as they are perceptually indistinguishable from black, white, or grey.
Generic palettes
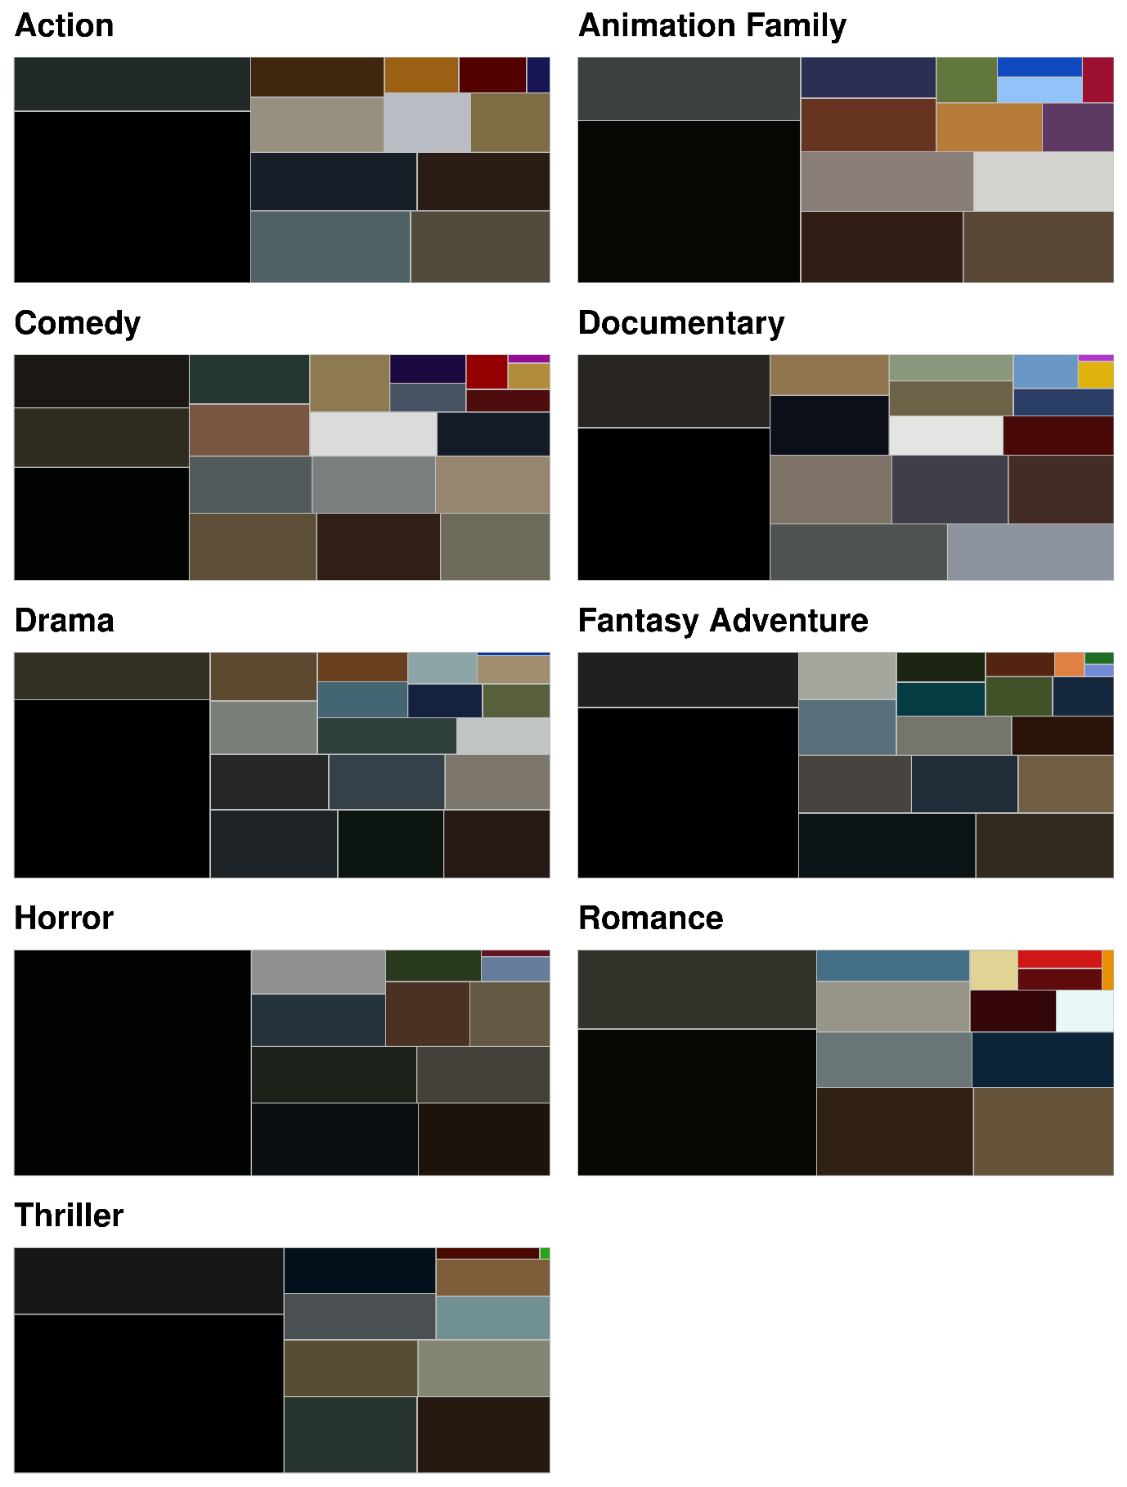
To get an overall view of the characteristic colours of a genre I construct a palette for each genre of trailers using the unfiltered generic data sets. Defining a palette for a genre can be treated as an unsupervised machine learning problem of dividing n objects (i.e., pixels) into k distinct groups (i.e., colours) using cluster analysis ( ). To construct a palette for each genre, I pooled the pixel data for the 100th row of each of the barcodes in a genre into a single data set and converted the RGB colours to the L*a*b* colour space using grDevices:: convertColor() ( ), a perceptually uniform colour space in which a colour is defined in terms of its luminosity (L*) and it positions on the red-green (a*) and blue-yellow (b*) axes, with the reference white at the CIE Standard Illuminant D65 ( ). I then applied a z-score transformation to scale the data before applying CLARA, a clustering method suitable for partitioning around medoids (PAM) with large data sets, using the fpc package for R ( ) to find the optimal number of clusters for the data across a range of possible values of k from 10 to 20, with 50 samples of 250 pixels for each value of k. PAM selects values from the data set as medoids to function as exemplars of a cluster and assigns the values in a data set to the nearest cluster based on the minimization of a distance measure between a value and its exemplar ( ). As the distance between two colours in L*a*b* colour space is the Euclidean distance between them, I used this distance measure for the clustering algorithm. An advantage of the k-medoids approach over k-means clustering, the standard method used for cluster analysis of colours in images, is that the cluster centres are drawn from the colours in the image which cannot be guaranteed using the k-means approach. After clustering, I reversed the z-score transformation to return the medoids to the original scale of the L*a*b* colour space. The resulting colour palettes for each genre is plotted as a tree map, where the area of a branch is proportional to the number of pixels assigned to a medoid, as an efficient way of visualising colour palettes, allowing for easy comparison without discarding information about the prevalence of a particular colour.
I calculate a range of summary statistics describing the palettes. The richness of a palette is the number of colours (k) it contains, though this is a crude measure of the difference between palettes. The diversity and evenness of a genre’s palette can be quantified based on the relative frequency of pixels in a cluster: , where n i is the number of pixels assigned to a cluster and k is the total number of clusters in a palette. Shannon’s entropy quantifies the degree to which data is distributed over its possible values and is sensitive to rarer pixels:
The greater the value of H, the greater the diversity of a palette. As different genres have different numbers of colours in their palettes, Pielou’s J′ statistic is a measure of the evenness of a palette, where J′ is the ratio of the observed entropy to the maximum possible entropy for k colours: . Simpson’s reciprocal diversity index also measures how pixels are distributed across colours but is more sensitive to the most abundant cluster in a palette, with values in the range [1, k] that increase as diversity increases:
Dividing S′ by k provides an additional measure of evenness: . Both J′ and S E take values in the range [0, 1], where 0 is maximally uneven (i.e., all pixels would be assigned to just a single colour out of k possible colours) and 1 is the maximum possible evenness, where all individuals are equally distributed across all categories and the number of pixels assigned to a colour would be equal to 1/k. See for a discussion of these indices.