DOI: http://doi.org/10.6092/issn.2532-8816/9040

Abstract

In this paper, I discuss using digital names lists compiled from analog sources for social network analysis. Using examples from finding aids of archival collections, I demonstrate how social network analysis can show relationships and contrasts between different datasets of names or be used to show relationships within a single set of names. Data visualization tools such as Gephi aid in the analysis and present the relationships in an easily understandable way. Exposing relationships between collections or within a collection increases its findability.

In questo paper viene presentato l'utilizzo di liste digitali di nomi provenienti da fonti analogiche, per l'analisi delle reti sociali. Attraverso alcuni esempi di liste, provenienti dalle collezioni d'archivio e strumenti di corredo, si intende mostrare come l'analisi delle reti sociali possa evidenziare relazioni e contraddizioni fra diversi dataset di nomi o possa essere utilizzata per evidenziare relazioni all'interno di un singolo dataset. Strumenti per la visualizzazione di dati come Gephy supportano questo tipo di analisi e presentano le relazioni individuate in maniera facilmente comprensibile. L'esposizione delle relazioni tra collezioni o all'interno di una singola collezione ne aumenta le possibilità di individuazione.

Introduction

Holocaust records are full of lists - deportations, ghetto residents, camp prisoners. List-making continued into the postwar period with lists of survivors published by various organizations, memorial lists of those who died, displaced person records and emigration records. However, these lists were made in analog format making analysis extremely difficult. In the last two decades, these lists have been indexed and placed online.

Memorialization is a primary motivation. The Jewish genealogical community has been particularly active in indexing. As prominent Jewish genealogist Arthur Kurzweil wrote, When the Nazis rounded up our relatives, they took away their names and gave them numbers. What we genealogists are with is taking away the numbers and giving them back their names. . Indexes can range from one list from one event in a certain town to complete websites compiled from multiple sources, such as the memorial to 600 men deported from Putten, the Netherlands .

Names lists can be also gleaned from finding aids where an archivist made the effort to list individual names.  Oftentimes, names list based finding aids consist of individual case files, such as in the United Restitution Organization files discussed later. However, some organizations like the Zydowski Instytut Historyczny Im. Emanuela Ringelbluma in Warsaw create appendices to finding aids that list the names of individuals mentioned in the collection .

Using Finding Aids

While archival finding aids have been available online since the early days of the internet, the electronic versions usually mimicked the format of their paper predecessors and only leveraged technology for searching and browsing of subject headings and keywords. The advent of Encoded Archival Description (EAD) data standard for the description of archival and other unpublished material allows researchers to find related collections within and across repositories. Some archives have experimented with using social navigation tools such as recommending and collaborative filtering . Several papers and projects explored applying data visualization techniques to help archival users find related collections within a repository. A recent project by Anne Bahde applied data visualization such as GoogleFusion and TimeMapper to finding aids in an effort to help researchers better understand a collection’s scope and to refer them to related collections . The Social Networks and Archival Context (SNAC) project in particular focuses on finding individuals within diverse archival collections and connecting them within networks. As of July 2017, SNAC does not contain any data visualization tools .

Social Network Analysis

Social network analysis is looking at sets of people, groups, places and things and mapping the interactions or relationships between them. In Holocaust studies, some examples would be the relation between a camp and its sub-camps, residents and housing within a ghetto or restitution organizations and claimants. Using already extant names lists allows for analysis to happen without the need to create new data sets. Data visualization provides an efficient graphical way to present the analysis.

This project used Gephi, an open source analysis and visualization tool. Gephi was chosen because it is free, open-source, runs on both Mac and Windows platforms and, most importantly, has a robust user community that provides extensive tutorials and other support. The author started the project with minimal exposure to data visualization tools but was able to teach herself Gephi using the tools available .

Analysing Names Lists

Separate but similar collections

Holocaust archives often contain collections that are related by topic or creator. Camp ledgers of incoming prisoners would be one example. Records of restitution organizations are another. The United Restitution Organization, founded in 1948, provided legal assistance to Holocaust survivors with their restitution and reparation claims against the West German government . At its largest, the URO had offices in West Germany, Israel, the United States, Canada, Argentina, Sweden, Great Britain, Belgium, France and several other countries. In countries with small survivor populations, the URO partnered with other Jewish organizations to provide legal services to survivors . The United States Holocaust Memorial Museum Archives holds the original paper files of the United Restitution Organization (URO) files for their Los Angeles, Buenos Aires and Toronto offices. The finding aids for Los Angeles and Toronto are Excel spreadsheets that include first and last names of claimant, their date of birth, and place of birth. The Toronto finding aid also includes information on which specific program applied to a claimant . Using a sample of 738 claimants from Los Angeles and 535 claimants from Toronto, the author did an analysis to determine if there was any link between a claimant’s home country and which URO office he or she used to file the claim. The analysis was directed, meaning that the links between nodes were in one direction, in this case countries of origin to URO office. In an undirected analysis the links between nodes can go either way, such as when analyzing correspondence between different people.

From the resulting graph visualization, the following observations can be quickly made:

  1. A greater percentage of Austrians and Germans used the Los Angeles office, which is not surprising since there was a large German-speaking émigré community in the Los Angeles area.

  2. The Los Angeles data is less complete, as the number of claimants with an unknown place of birth is much larger than for Toronto.

  3. Survivors from Poland included in these example datasets were more likely to apply using the Toronto office, again not surprising because of immigration patterns.

The limited data included in the Los Angeles URO finding aid precludes any further in-depth comparison with the Toronto data. However, further work could be done using the Toronto data alone, for example by determining what percentage of claimants applied to each claim program or to determine how many claimants applied to multiple programs.

Visualizing data from one collection

One of the largest collections in the United States Holocaust Memorial Museum Archives is RG-14.070, the General State Prosecutors Office of the State Court of Berlin records (Berlin Landesarchiv Fond A Rep. 358.)

This collection contains approximately 150,000 cases from the Berlin prosecutor’s office from 1933 to 1945. The cases include both Nazi-specific crimes (political offenses, race defilement) and ordinary crime (theft, manslaughter, illegal duplication of keys.) The finding aid is an Access database that allows for each searching but not for easy analysis of the cases. The Berlin Landesarchiv developed codes
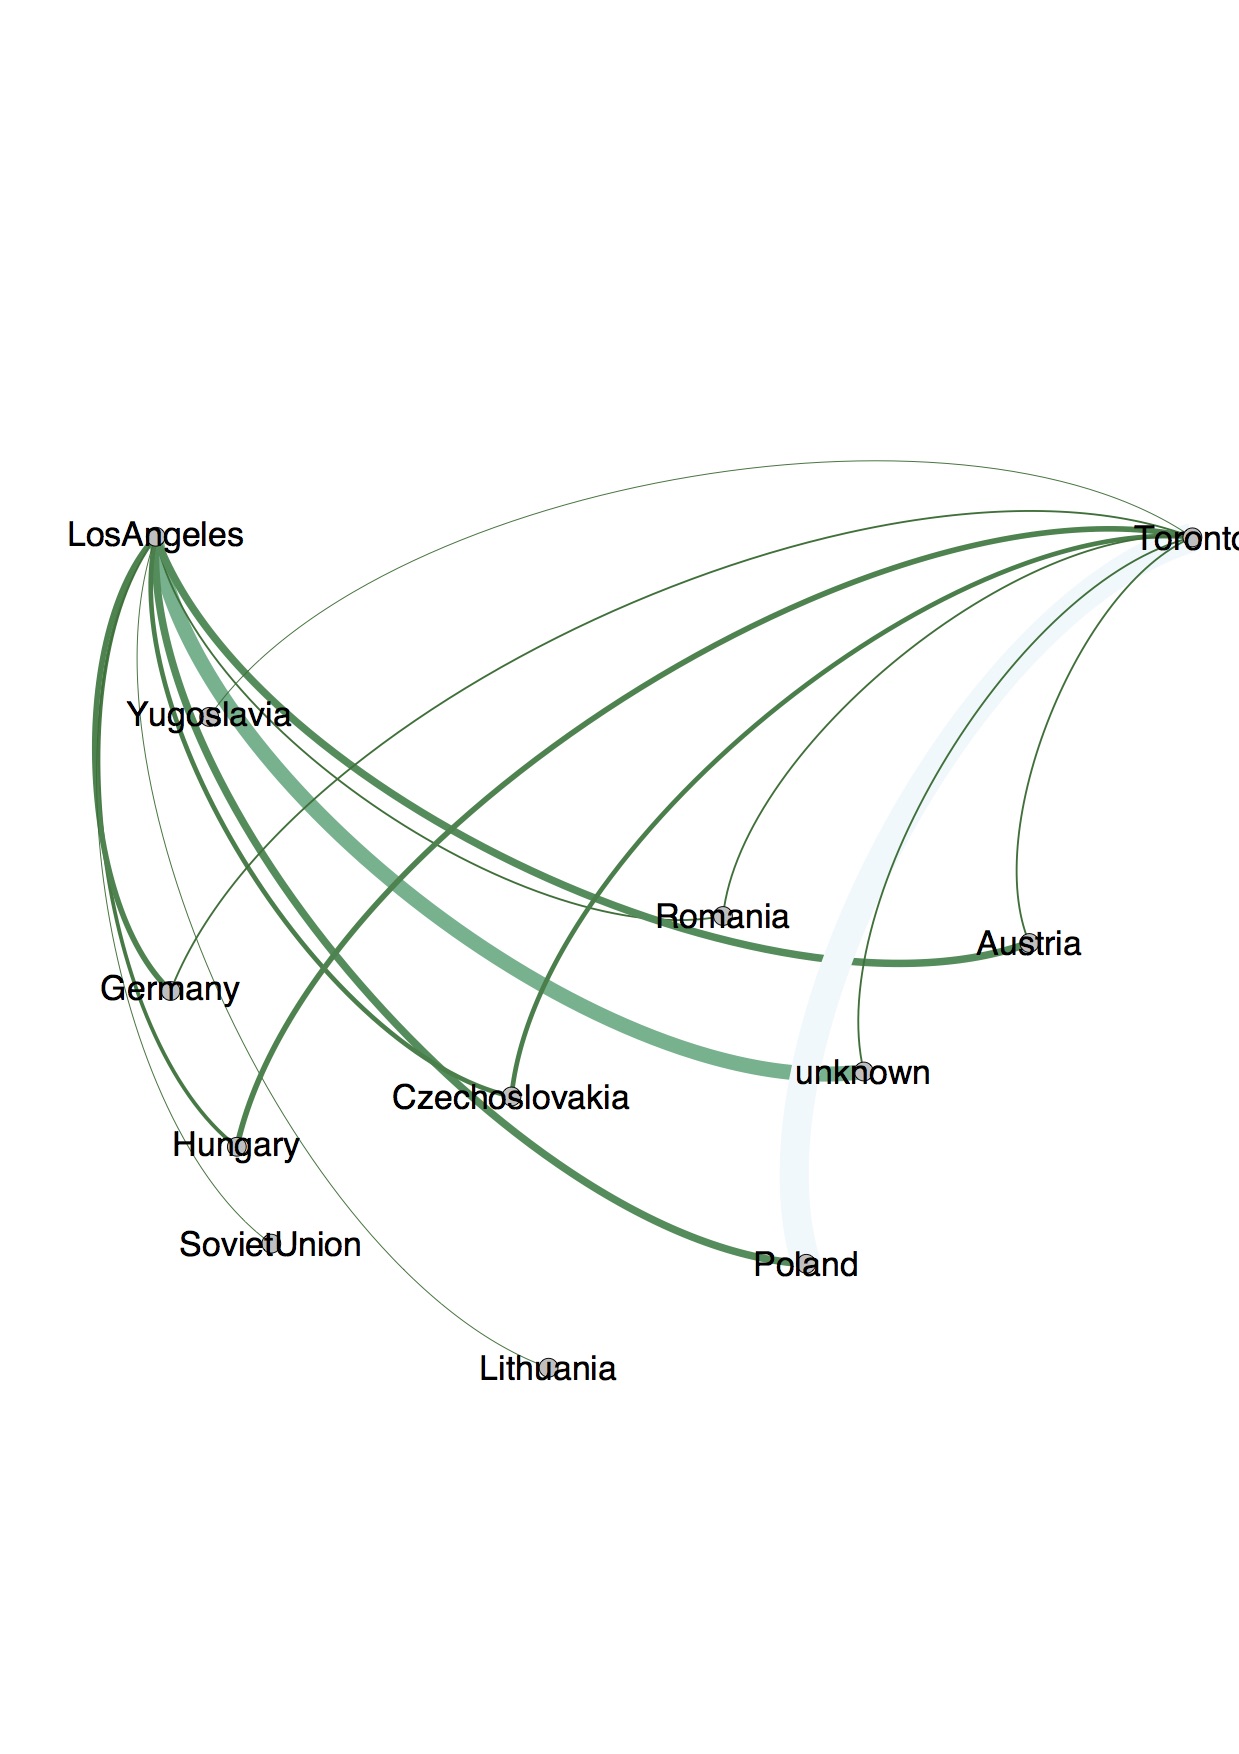
Visualization showing home countries of claimants to the Los Angeles and Toronto URO offices

Visualization showing home countries of claimants to the Los Angeles and Toronto URO offices
Victim type Special Punishment

Ausländer (AL) Foreigner

Asocial Sicherungsverwahrung(SV) Preventative detention

Juden (JD) Jew

Heil- u. Pflegeanstalten (HP) Mental institution

Homosexuelle(HS)

Homosexual

Euthanasie (EU) Euthanized

Politisch Verfolgte (PO)

Political persecutee

Kastration (KA) Castrated

Gewohnheitsverbrecher (GV) habitual criminal

Todesurteil (TD) Death Sentence

Deserteure (DS) Deserters

Hinrichtung (HR) Execution

Sinti u. Roma (SR) Roma and Sinti

Straflagerhaft (SL) Prison Camp

Bibelforscher (BS) Jehovah's Witness

Einweisung in ein KZ (XKZ) Concentration camp

Asozialer (AS)

List of special codes in finding aid for RG-14.070

Network based on punishment

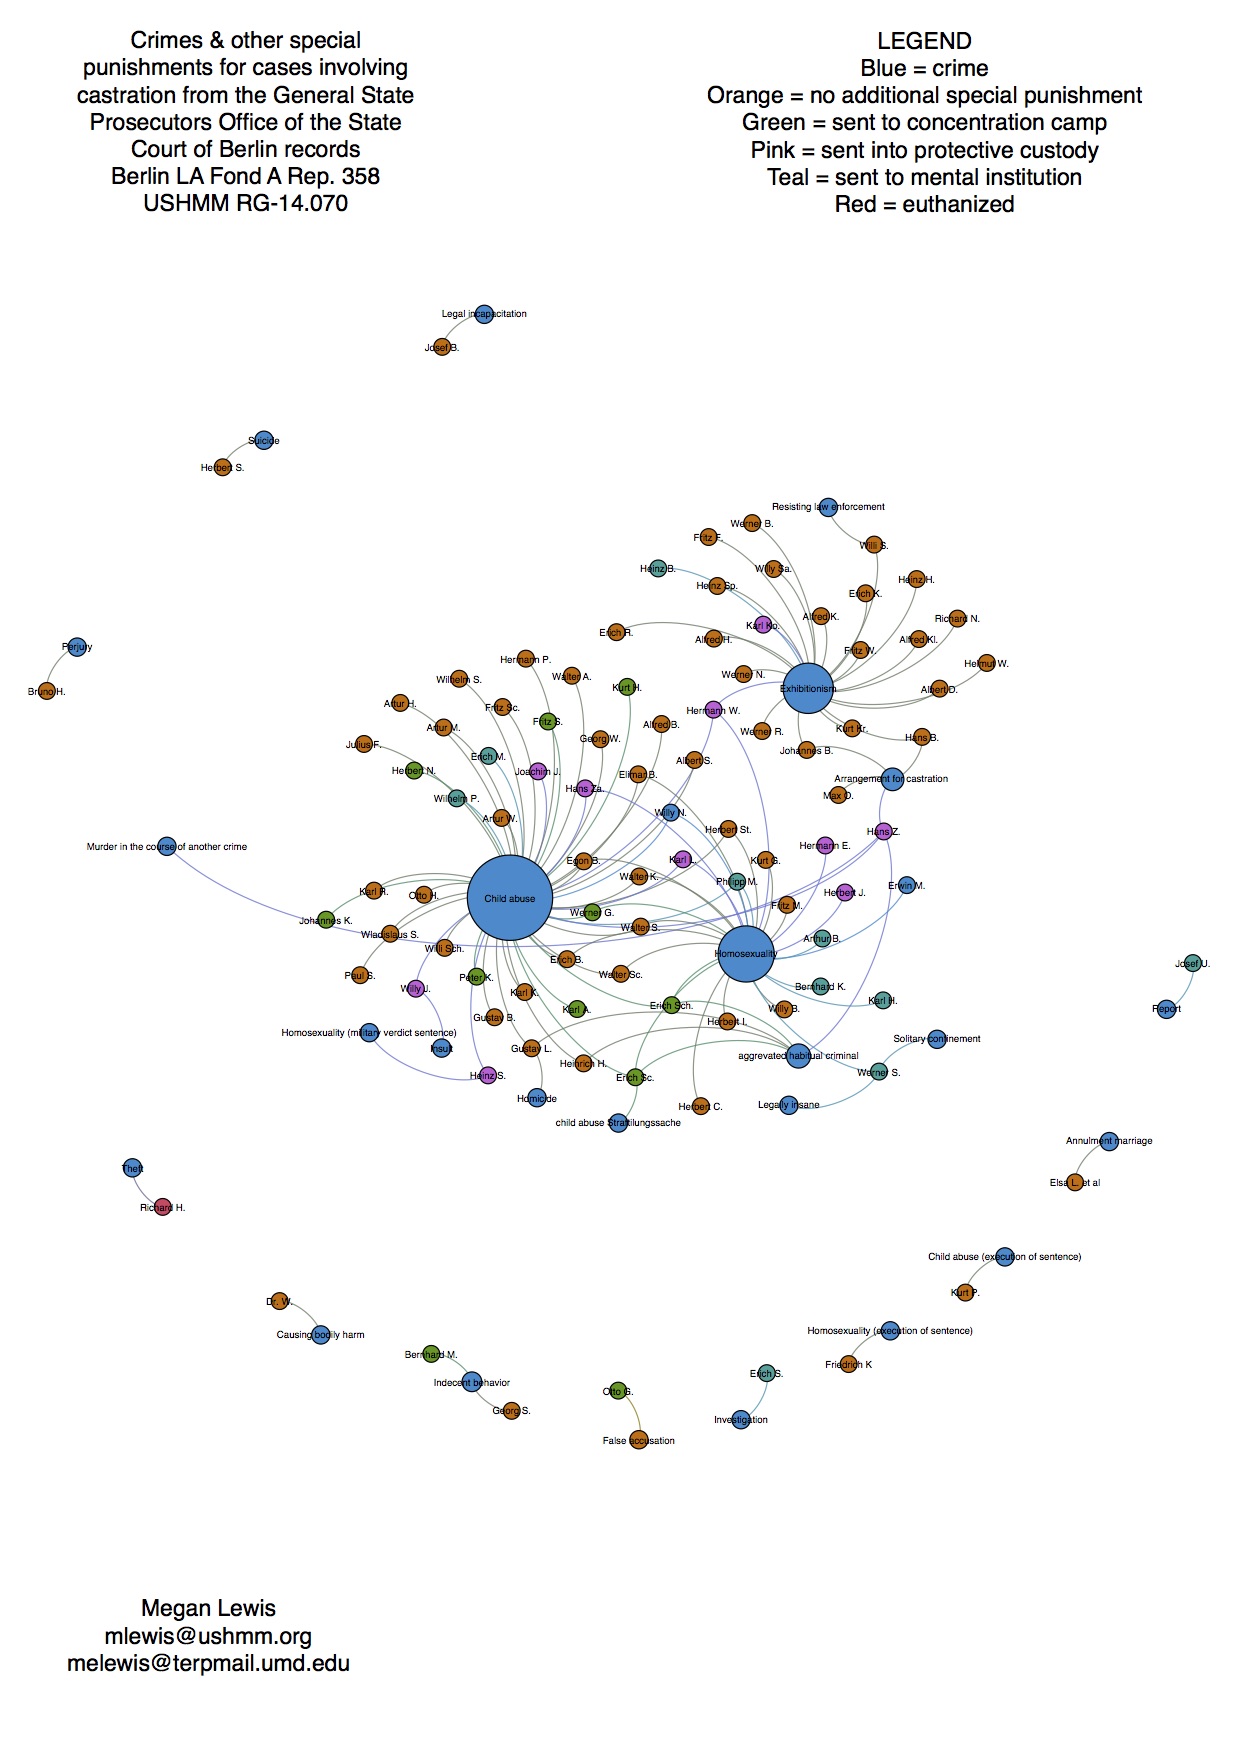
Castration was used as a special punishment and 130 were subjected to it. Looking at these cases, the following questions can be asked: What crimes did they commit? Did these men commit multiple crimes? What other punishments did they receive?

Using the same set of data, the following three graph visualizations were created. The first graph charted what types of crimes the castrated men committed. Using statistical tools built into the Gephi program, number of instances of each type of crime were statistically weighted. The weight of each crime is indicated by both node color and size. The author was surprised to learn from this graph that the third most common crime committed that lead to castration was exhibitionism/creating a public disturbance. The most common two crimes were not surprisingly child sex abuse and homosexuality.

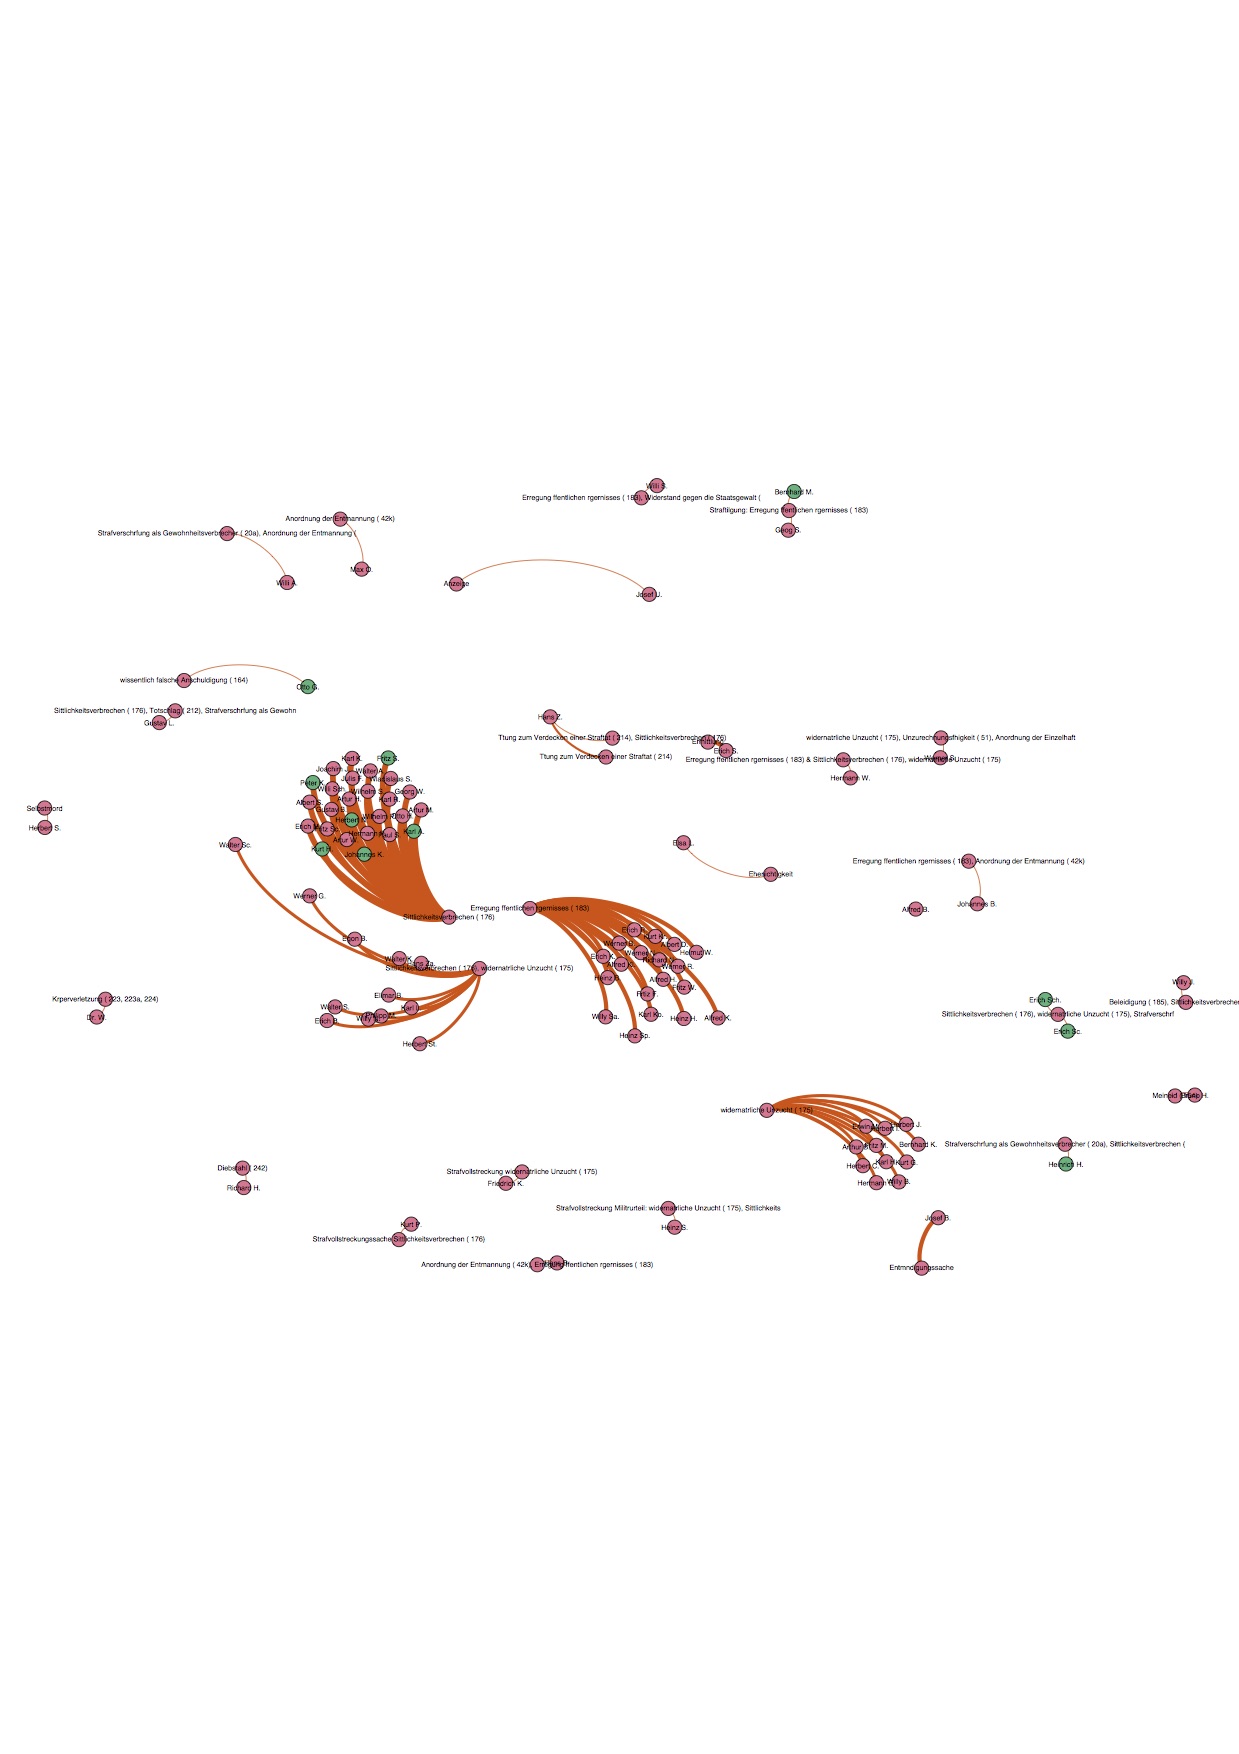
The following graphs demonstrate the importance of direction. In creating a graph in Gephi, one set of variables is the source and the other set is the target. Switching the source and the target within a directed graph provides very different results. visualizes the data when the type of crime is the source and the individuals are the targets. In this example individuals who committed more than one crime are not connected to both crimes. While this graph gives a good snapshot of the different crimes available it does not display the network very well.

In , the directed relationship was reversed. The individuals were the source and the types of crime were the target. This graph allows one individual to be connected to more than one type of crime and better illustrates the relationship between individuals and crimes. From this graph, a researcher can tell that a sizable percentage of the castrated men were charged with both homosexuality and child sex abuse. The use of the Fruchterman-Rheingold algorithm on the data in this graph forces the more connected crimes and the crimes with more instances to the center of the graph.

also displays another feature of social network analysis graphs- the ability to assign different attributes to nodes and indicate them by using different colors. In this figure, the different attributes indicate any additional punishments applied to the individual. In the case of the castrated men, the most common additional punishments were being taken into protective custody and being sent to a concentration. By making the effort to include attributes in a data visualization graph based on a finding aid, an archivist can expose the collection to researchers who may not otherwise consider the collection as a resource. For example, the castrated men may be of interest to historians studying Dr. Carl Peter Jensen, aka Carl Vaernet, a Danish doctor who conducted pseudo-medical experiments on artificial hormone implants in the Mauthausen concentration camp . He used castrated men in some of his experiments. A brief search for five of the men sent to concentrations camps in the International Tracing Service records revealed that two died in Mauthausen. Additional research would be needed in the Mauthausen records to determine if these men were part of Carl Vaernet experiments. Researchers studying mental institutions in the Nazi era, which were part of the euthanasia program, now have several additional names to research.

The networks around the edge of the graph in Figure 5 show the less common types of crimes and other investigations, plus additional punishments. Richard H. was arrested for theft and later was euthanized. Willi B. resisted law enforcement but suffered no additional special punishment. The Prosecutors Office investigated one suicide and one case of legal incapacitation within this group of men.

The General State Prosecutors records are an ideal candidate for additional analysis and visualization because of the inclusion of the special codes by the creator of the finding aid. This author is currently working on visualizations using cases that involved Rassenschande (race defilement) and individuals given the designation GV, Gewohnsheitverbrecher, or habitual criminal. Initial results of the GV analysis review that only a small percentage of the individuals were charged under paragraph 20a of the German criminal code which defined the conditions for the designation to be applied.
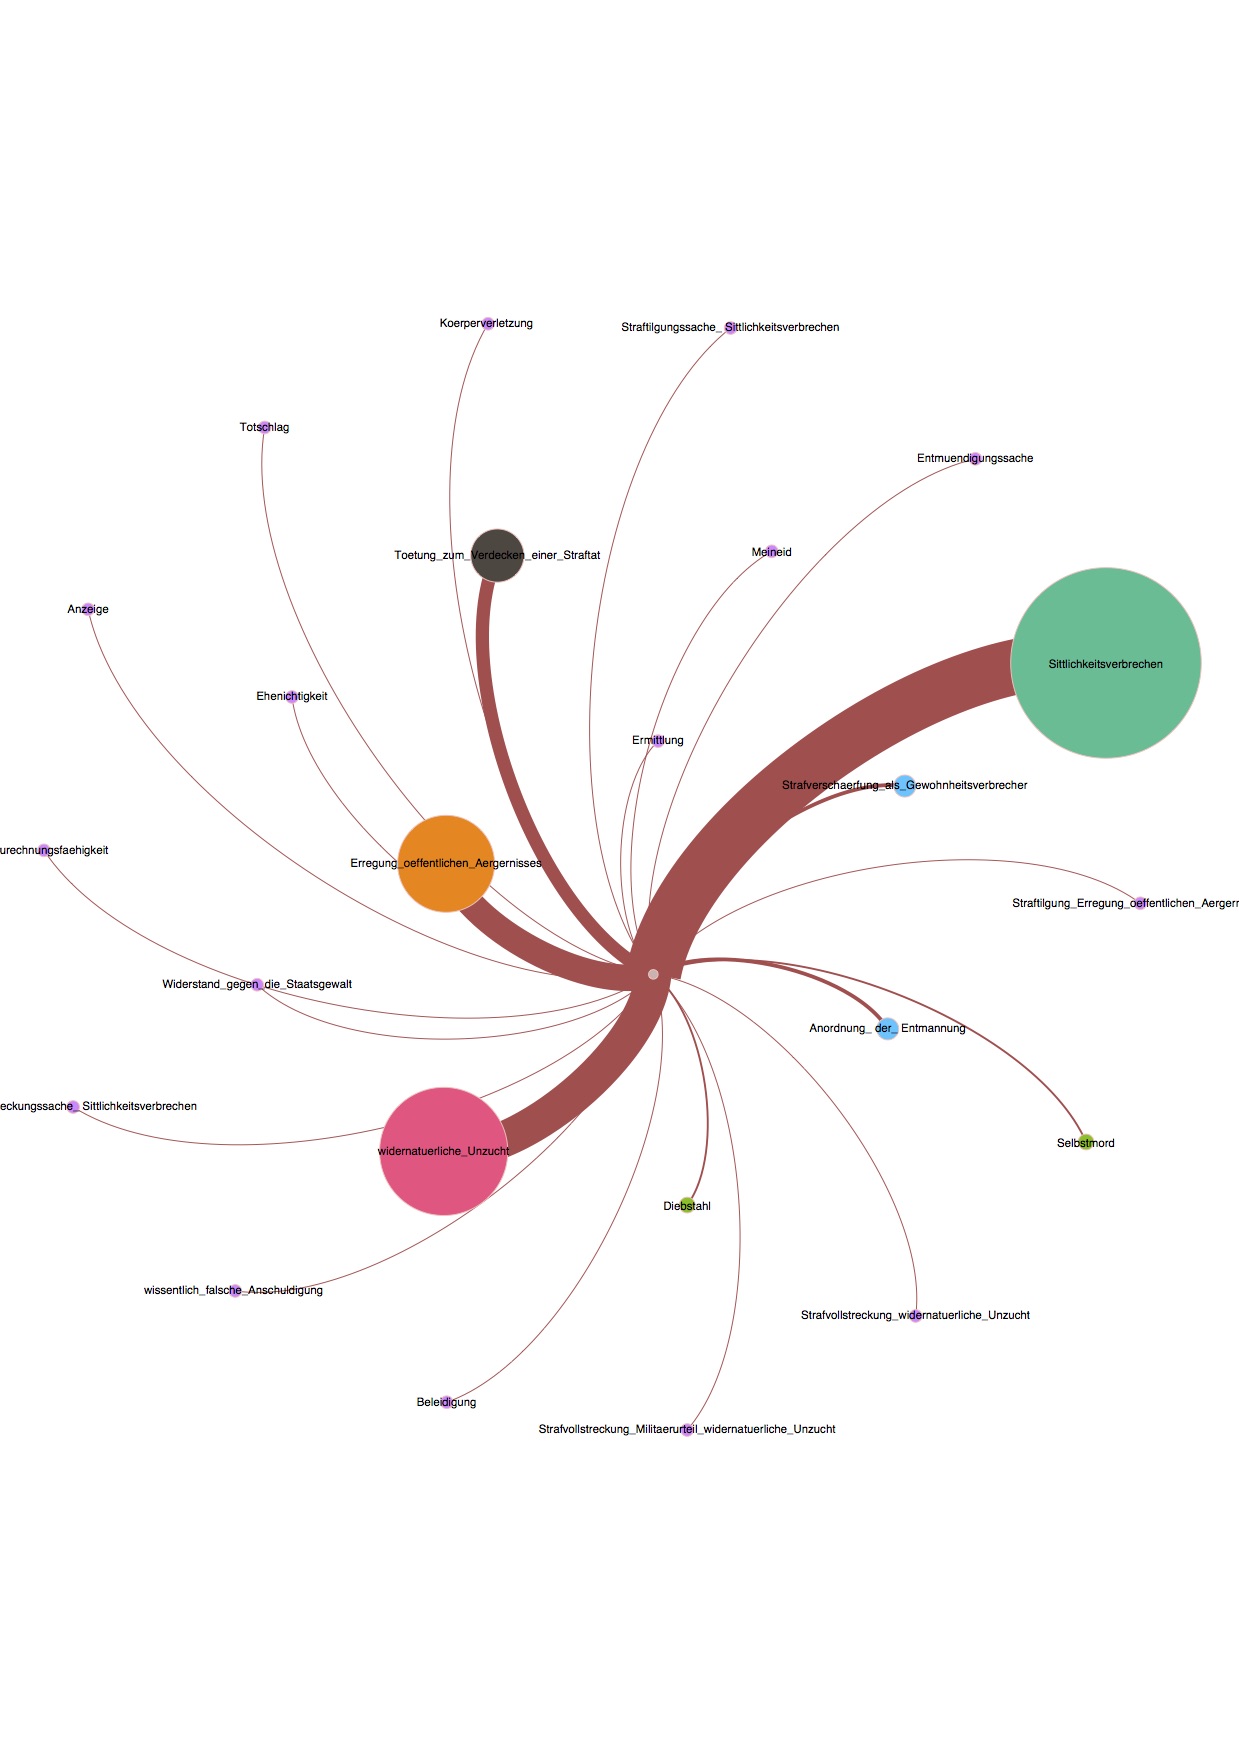
Graph of crimes statistically weighted both in nodes (with different colors) and edges (in brown)

Graph of crimes statistically weighted both in nodes (with different colors) and edges (in brown)

Graph of the instances of each type of crime with the crime type being the source and the individual being the target

Graph of the instances of each type of crime with the crime type being the source and the individual being the target

Graph of crimes and individuals with the added attribute indicating additional punishments. The direction of the graph is from person to the crime.

Graph of crimes and individuals with the added attribute indicating additional punishments. The direction of the graph is from person to the crime.

Unfortunately, most finding aids are not as rich in detail. This author envisions more complex network analyses that can be made, such as comparing a memorial names list created from testimonial sources to a list from a finding aid of a collection from the same place, analyzing lists from two archival finding aids about related topics from different organizations, and an analysis of two lists based on testimonial of victims from the same place. An extremely complex analysis would involve survivors originally from Austria who used the services of the United Restitution Office, the list of Austrian Jews who filed property declarations known as Recht als Unrecht (which has both memorial and finding aid functions), the list of Jews whose automobiles were confiscated created by the Vienna Technical Museum and the lists of claimants on the Austrian government website findbuch.at.

Challenges

Using names lists on memorial sites and in finding aids holds promise of interesting findings. However, researchers wanting to use these sources face several challenges.

Lack of Available Linked Open Data

A major challenge is the lack of linked open data freely available on the internet. Most names data available is only accessible to the public via a search interface, making the pulling full lists difficult. Some finding aids are only available at the host institution. Such is the case with the United Restitution Organization records at the United States Holocaust Memorial Museum. This restricted access exists for several possible reasons. One reason is the issue of privacy and data protection laws. Another reason is the desire of the owning institution to know who is using their data. Finding aids can contain personally identifiable information such as dates of birth. The owners of the three collections used in the data visualizations in this paper all require researchers to sign user declaration stating that the researcher understands and will comply with the rules and regulations of the institution with regards to privacy, providing copies of published works, and copyright. For the hypothetical complex Austrian example mentioned above, only Recht als Unrecht is available online as a complete dataset, and even then, it is buried on the website of the Jewish genealogy publisher Avotaynu. The URO finding aids are only available onsite at the United States Holocaust Memorial Museum, the Vienna Technical Museum database is only available via a search interface, and Findbuch.at requires a registration process that including submitting a scan of a passport.

Data normalization

Another challenge is data normalization between or within a dataset. Often the challenge is a matter of time, as normalization can be time consuming. While some normalization can be automated, such as dates, other data types require human intervention. Place names commonly need to be normalized requiring human intervention. One of the claimants in the URO Toronto records listed her place of birth as Czernowitz, Ukraine, combining the pre-1918 place name with the post-1992 country, even though at the time of her birth the city was officially Cernauti, Romania. Part of the normalization process is determining what standard to use.

Conclusion

Names lists that are part of memorials or are found in archival finding aids provide datasets for social network analysis. When turned into data visualizations, researchers can discover previously unseen connections. In addition, visualizations can increase a list’s or archival collection’s findability and expand their use in research.

Acknowledgments

My thanks to the organizers of the conference Data Sharing, Holocaust Documentation and Digital Humanities for this opportunity and for their comments. This project started as part of my course work for a post-MLS certificate in the Curation and Management of Digital Assets at the University of Maryland iSchool, College Park, MD.

References

  1. “About SNAC,” Social Network and Archival Context, http://socialarchive.iath.virginia.edu/about.html

  2. Bahde, Anne. 2017. Conceptual Data Visualization in Archival Finding Aids: Preliminary User Responses. Libraries and the Academy 17:3, pp. 485-506. https://preprint.press.jhu.edu/portal/sites/ajm/files/17.3bahde.pdf

  3. Gephi: makes graphs handy, https://gephi.org/.

  4. History of the United Restitution Organization, https://www.cjarchives.ca/archives/uro/history/history.htm .

  5. Kurzweil, Arthur. 2004. Introduction. In Avotaynu Encyclopedia of Jewish Genealogy: Guide to Jewish Genealogy, ed. by Sallyann, Amdur Sack and Gary Mokotoff. Bergenfield, NJ: Avotaynu.

  6. Pasternak, Alfred. 2006. Inhuman Research. M edical experiments in German concentration camps. Budapest: Akadémiai Kiadó, p. 360.

  7. Rothfeld, Anne. 2000. A Source for Holocaust Research: The United Restitution Organization Files. Perspectives on History, https://www.historians.org/publications-and-directories/perspectives-on-history/april-2000/a-source-for-holocaust-research-the-united-restitution-organization-files.

  8. Stichting Oktober 44, http://www.oktober44.nl/monument

  9. Yakel, Elizabeth, Seth Shaw and Polly Reynolds. 2007. Creating the Next Generation of Archival Finding Aids, D-Lib Magazine 13:5/6, http://www.dlib.org/dlib/may07/yakel/05yakel.html.

Last URLs access: July 20, 2017

For an example, see the index of names for the American Joint Distribution Committee in Poland 1945-1949 records created by ZIH archivists Tadeusz Epsztein and Agnieszka Reszke at https://collections.ushmm.org/findingaids/RG-15.120M_03_idx_pl.pdf. A copy of this collection is held at the United States Holocaust Memorial Museum Archives as RG-15.120.

The Toronto URO files are USHMM RG-28.005, https://collections.ushmm.org/search/catalog/irn503540. The Los Angeles URO files are USHMM RG-28.004, https://collections.ushmm.org/search/catalog/irn503539. The Buenos Aires URO files finding aid lists only claimant’s name.

Additional information on this collection is at https://collections.ushmm.org/search/catalog/irn517822

See .