In this work, we present LOD Navigator, a data visualisation and exploration tool to track the lives and trajectories of Italian Shoah Victims. We take advantage of the work done at the Contemporary Jewish Documentation Center in Milan (CDEC), leading to the publication of a database of Linked Open Data (LOD) containing information about the life and persecution of each victim. Such database was then enriched semi-automatically and uploaded in the LOD Navigator, giving the possibility of getting new insight into collective traits of the Italian Shoah tragedy and into personal stories of victims. Information is now available and can be navigated in an intuitive and interactive way.
In questo paper viene presentato LOD Navigator, uno strumento di ricerca e visualizzazione dei dati per la tracciatura dei percorsi delle vittime della Shoah in Italia. Per lo scopo è stato utilizzato il database LOD, pubblicato dalla Fondazione CDEC di Milano, contenente le informazioni sulla vita e la persecuzione di ciascuna vittima. Tale database è stato arricchito in maniera semi-automatica e caricato sul LOD Navigator. Questo strumento offre la possibilità di ottenere una nuova comprensione dei percorsi comuni della Shoah in Italia e le storie personali delle singole vittime. Le informazioni possono essere navigate in maniera intuitiva e interattiva.
Introduction
The Contemporary Jewish Documentation Center in Milan (CDEC) has recently developed a database with information on Italian Shoah victims and, following a data sharing policy, has made it freely available as Linked Open Data (LOD). The database was built starting from information collected in Picciotto Fargion and is accessible through a web portal, i.e. the CDEC Digital Library, and a SPARQL endpoint.
In order to provide a novel way to navigate this database taking advantage of the available high-quality records, we developed the LOD Navigator, a system that allows users to explore the trajectories of victims during their persecution both at micro and at macro level. The goal of the application is to enhance the value of the original database with a user-friendly interface focusing on an important research field in Shoah studies, i.e. the geographies of the Holocaust.
Information necessary for implementing the LOD Navigator was collected using the SPARQL endpoint: this information includes biographical data together with details about the persecution and deportation of each victim. The places of birth, arrest, detention, deportation to a Nazi camp, transfer, and return after liberation (if available) were then semi-automatically georeferenced and associated with the corresponding date. We then considered a movement as a trajectory from one georeferenced place (associated with a dated event) to another georeferenced place. All the movements are then displayed in the LOD Navigator through an interactive interface made freely available as a standalone tool.
We decided to focus our attention on movements because the Holocaust was characterized by many spatial processes. Concentration, deportation, dispersal, dislocation are all geographical components involved in the implementation of the Nazis' genocidal policy. Plotting data about these spatial processes on a map and giving them a temporal dimension allows the identification of spatio-temporal patterns at the macro-level but also at the micro-level, to reconstruct individual experiences.
The remainder of this paper is structured as follows. presents background information about past studies. describes how we obtained, cleaned and integrated the data. Details on the interface are also given. Discussion about the data visualised in the LOD Navigator is provided in . Finally, in we draw some conclusions and we list possible future developments.
Related Work
The ability to move groups of people separating them from their original social context is a crucial strategy in every genocide . In the case of Nazism, the genocidal policies were characterised by radical spatial acts, euphemistically represented in Schutzstaffel's bureaucratic jargon with terms such as Auswanderung (emigration), Aussiedlung (resettlement) and Wohnsitzverlegung (change of residence) . The literature reports on a number of works dealing with this territorial dimension of the Holocaust and thus belonging to what Knowles et al. call the spatial turn in Holocaust studies.
Theoretical and historiographical aspects of Nazism seen as a spatial project are discussed in the papers collected in Giaccaria and Minca . In particular, Stone highlights how Holocaust affected the entire continent: it was not just a matter related to specific places such as extermination camps, but the violence was widespread in both small and big sites in every nation.
In and the focus is on the use of GIS (Geographic Information System) and geovisualisation as means to rethink the Holocaust at different levels of analysis. The former, for example, presents a prototype visualisation of the journeys of eight Hungarian Jews, while the work by Giordano and Holian analyses the patterns of arrests of Jews in Italy from a spatio-temporal perspective, using Libro della Memoria as their source of data. This last analysis is paired with an interactive visualisation showing the distribution of arrests per month during the period 1943-1945. This representation focuses solely on the arrest, seen as the starting point of the whole persecution process that determines the status of victim, while it does not take into consideration all the other persecution stages. Furthermore, not all victims are included in the analysis: for example, those killed in massacres or arrested outside Italy are excluded.
With respect to these examples of previous work, our application differs in at least 3 aspects: (i) it follows the lives of the largest possible number of victims, so as to provide information representative of the phenomenon; (ii) it represents all the major events related to the persecution of Jews; (iii) it offers novel insight not only by aggregating data according to several categories, but also by allowing the close reading of individual stories.
Workflow
To develop the final system version, we performed 4 main tasks: we manually analysed the available data, we extracted the data that were interesting for our aim, we manipulated them to remove inconsistencies and add missing information. Finally, we implemented the data visualisation functionalities in the LOD Navigator. These phases are detailed in the next subsections.
Data Observation
First of all, we manually analysed the data available in the CDEC digital library and the corresponding RDF browser to select the information we should focus on to build the application.
In the RDF browser, biographical information is given for each person, identified by a unique ID, together with information about his/her persecution. This information is structured on the basis of the Shoah domain ontology that formally describes concepts and relationships characterizing the process of persecution of Jews in Italy between 1943 and 1945 [,]. In particular, the ontology Class called Persecution describes the arrest, detention, deportation to a Nazi camp, the transfer to another camp but also the liberation and massacre. This class is related to the Person class that includes properties connected to biographical information, such as the date and place of birth and death. Other information, for example family relations between victims, was present in the database but was not considered relevant in this phase of the development.
Data Extraction
We queried the SPARQL endpoint to retrieve all the information we needed and we chose to obtain results in CSV format.
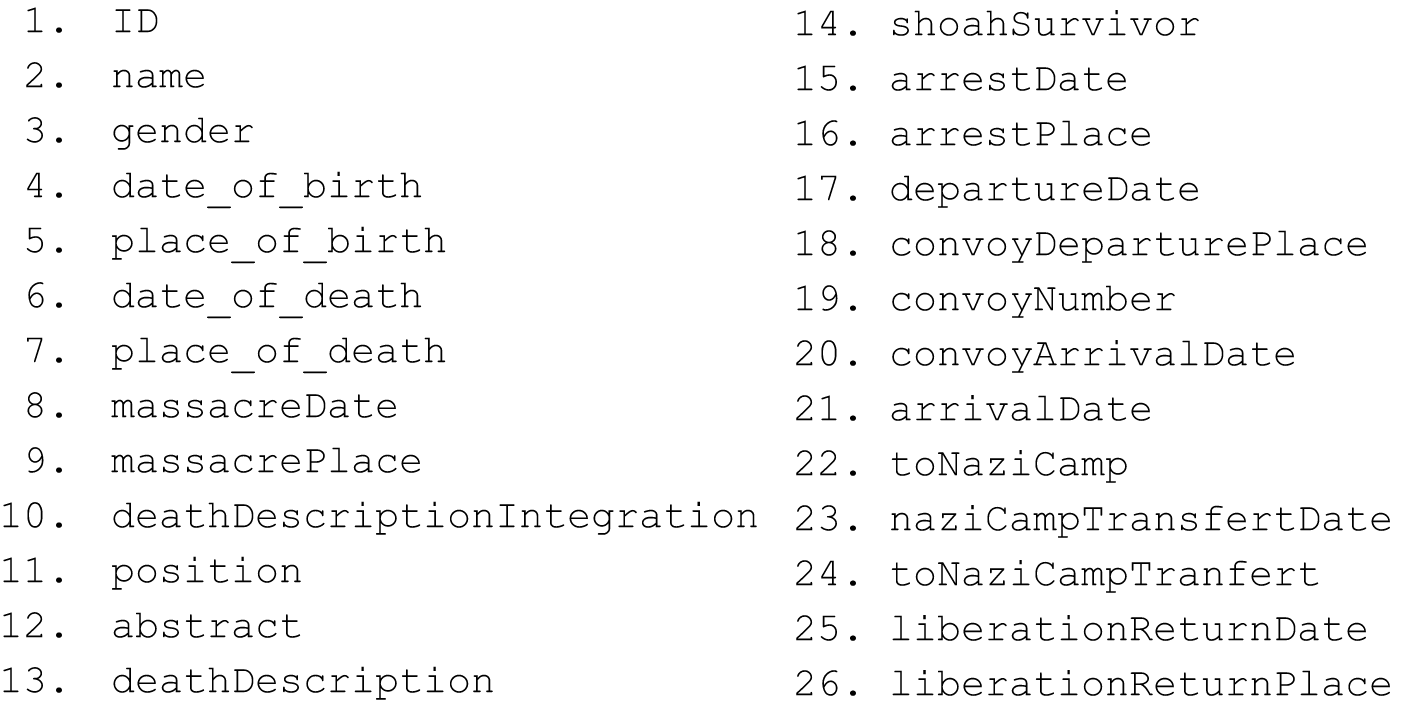
In this way we extracted the content of 26 properties (see ) for 9,042 people identified as Italian victims of the Shoah. These properties include basic personal information such as gender and place of birth and death, but also details on the different events related to Shoah in each person's biography, for example the date and place of arrest, the date of transfer to the Nazi camp and the type of death. Overall, we selected all properties necessary to trace the personal trajectories of the victims along a timeline.
Properties whose content was extracted from CDEC LOD dataset
Data Manipulation and Integration
In the third step, we performed a semi-automatic check of the data formats to fix inconsistencies. Since the information had been manually recorded, possibly by different persons, in some cases data formats and conventions were not homogeneous. Besides, we decided to simplify some information associated with each biography and add details that can help the user's navigation.
A particularly challenging case was the format of dates, which we found in 14 different variants including at least the year (e.g., 19250315, 1900, 16/06/1944, 1944.02.26). These date versions have been converted, using a Python script, in a unique format: YYYY-MM-DD. We also found 8 different conventions to express the lack of temporal information, such as 0 or ?. In this case, we could not give a temporal anchor to the corresponding event, therefore we had to remove the event from the database.
We also decided to modify people occupations by clustering the available options into coarse-grained categories to simplify navigation for end users. While in the LOD database we found 168 occupations, we observed that some of them were only little different, for example calzettaia / female hosier and calzettaio / male hosier. So we used Wikipedia classification of occupation types and we selected 27 coarse-grained categories, onto which we mapped the original ones. In this way calzettaia / calzettaio / calzolaio were clustered all under the category Craft occupations. For all victims without an associated occupation, the unknown category was added.
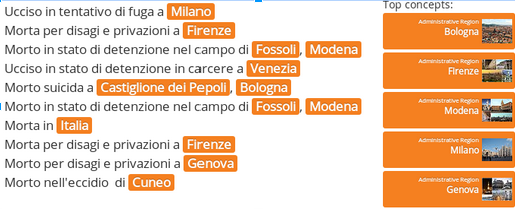
In case the place_of_death property had no value, we automatically extracted the places mentioned in the free-text descriptions of the field deathDescriptionIntegration. This was performed using The Wiki Machine, a system that links the concepts mentioned in a document to the corresponding Wikipedia page describing them. By selecting only the pages referring to a place, we automatically identified geographical mentions. For instance, giving as input the sentence Ucciso in tentativo di fuga a Milano/Killed in an attempt to escape in Milan, the tool links Milano to the corresponding Wikipedia page, and annotates the word as a location, more specifically as an administrative region, as shown in .
Example of output of the Wiki Machine
Another integration we performed semi-automatically was adding the country of origin of each victim. This information was obtained by looking up the abstract property, which always contains a sentence such as: She was born in France....
Since the final goal of LOD Navigator is to display the places on a map, another crucial step involved georeferencing place names, that is finding the coordinates of locations. In total we found 1,493 unique places in the data and we used Nominatim to automatically retrieve their latitude and longitude. In 15% of the cases this automatic process failed and we had to manually correct wrong coordinates (for example, Nominatim locates Siena in China) or we had to georeference places by hand because Nominatim could not find any coordinate. Sometimes this was due to the presence of some non-standard spelling but through spelling normalization it was possible to map different versions to the correct name and to precise coordinates (e.g. spelling variant: Gross-Meseritz -- standard spelling: Groß Meseritsch). For other locations, we could only make an approximation by using latitude and longitude of the country they should belong to, inferring this information from the content of other fields. For example, we could not locate Choumbla, but it was possible to associate it to the coordinates of Bulgaria, taking this information from the content of the abstract property: Menachem Levi, son of Haim Levi and Veneziana Benveniste. He was born in Bulgaria, in Choumbla, on July 23 1876.
At the end of the step, all retrieved data were corrected and harmonised, and they were converted in JSON format. Each victim was associated with biographical information and the list of his/her movements.
Data Visualization
The last step involved building a tool to support data visualization and navigation. To this end we employed standard open-source technology: i.e., Node.js as JavaScript run-time environment, Electron as framework for the development of the graphical user interface, Leaflet to built the interactive map. Moreover, trajectory arches are rendered in a vector image format (SVG) that facilitates interactivity by easily managing user interface events such as click and mouse-over.
The interactive interface of LOD Navigator allows users to search by name or place using an auto-complete function, to refine the search by temporal constraints with a timeline, to filter victims by country of origin, occupation, gender and death description (e.g. Dead in massacre or Dead in extermination camp). If a specific person is selected, a fly-over functionality enables users to display the trajectories from one location to the other, recreating a victim's story. Each movement is paired with a sentence automatically generated by combining the type of event (e.g. arrest), the corresponding date and place and, as for the arrival to the Nazi camp, the number of the convoy. e.g. Primo_Levi-5002 - Arrived in Auschwitz on February 26, 1944 with convoy number 8.
In addition, for each person there is a direct link to the corresponding entry in the CDEC Digital Library, where users can find additional information related to the victim (e.g. family relations, images, documents).
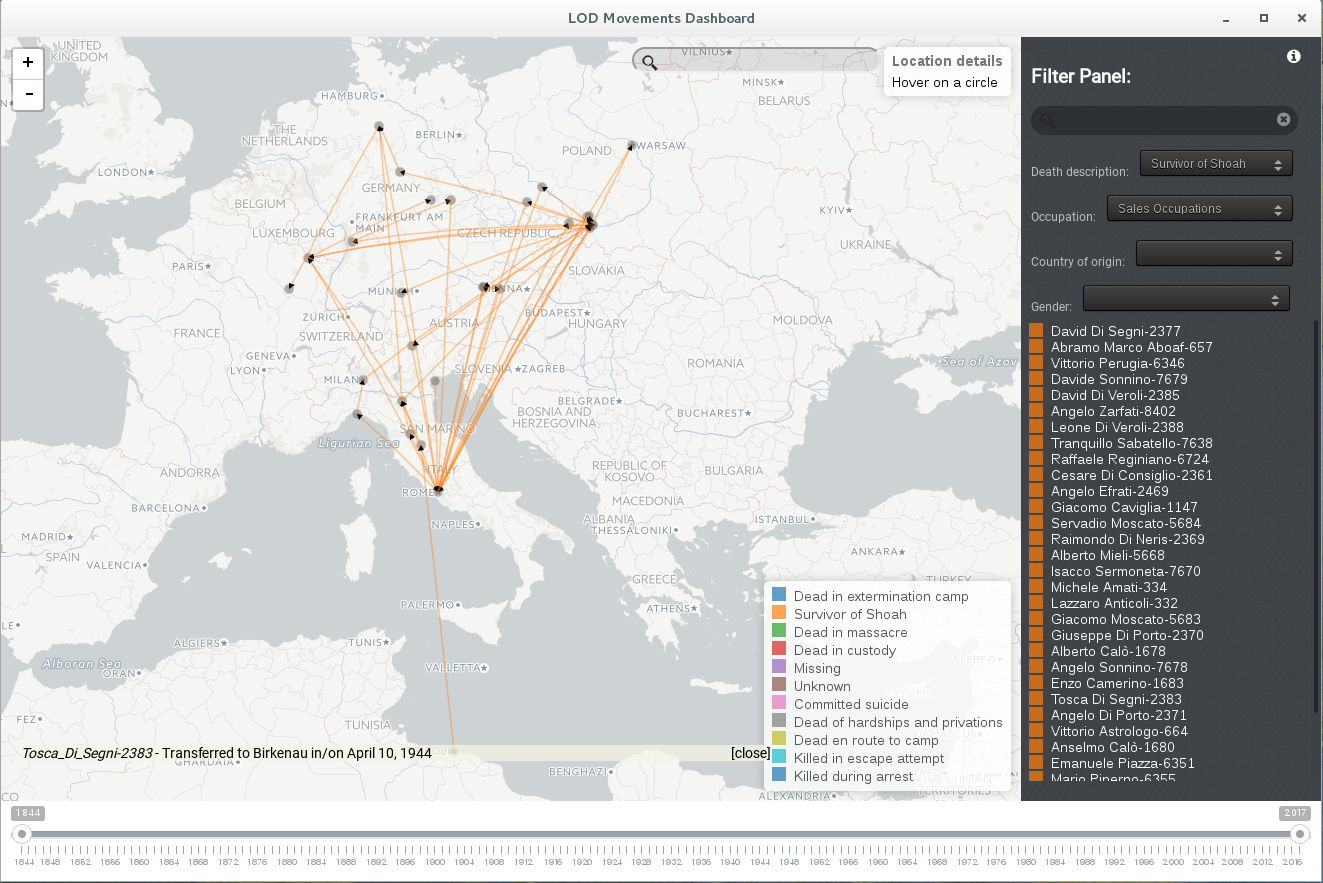
Screenshot of the interface: movements of Jews having a craft occupation and survived to the Shoah
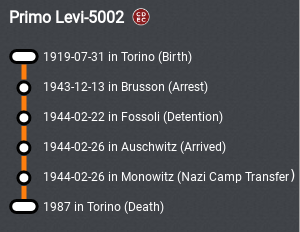
The different properties extracted from the CDEC LOD dataset can be used in the Navigator to set filters and view aggregated data. For example, shows the movements of all the Shoah survivors having sales occupations: filters are displayed on the right, victims resulted from the query are listed below the filters and places can be searched using the search field at the top of the map. Furthermore, a timeline is at the bottom of the interface together with a legend explaining the match between trajectory color and the value of the death_description property. Trajectories have a black arrow indicating the route destination. The marker flagging each location can be clicked to see the list of people that passed through that place. Aggregated information can also be zoomed in to analyse the life and destiny of a single person. For example, presents how the content related to Primo Levi is displayed by using a metro-like visualisation. The fly-over functionality is activated by clicking on a single event in the list, which automatically displays a detailed view of the place where the event occurred.
Metro-like visualization
Quantitative and Qualitative Data Analysis
The LOD Navigator contains information about 8,712 victims (4,470 males, 4,239 females, and 3 of unknown gender) that, according to the analysis described in , were found to have at least one dated movement between two georeferenced places. This means that the application displays the lives of 96.3% of all the victims recorded in the CDEC LOD dataset. Most of them (89.8%) do not have a specified occupation: among the others, the most common category is Sales occupations with 407 people having jobs such as salesperson, peddler and shop assistant. As for the country of origin, victims were born in 37 different nations: Italy is the most represented country (4,276 people) however the remaining 36 countries cover 49% of all the victims. This shows that, although we deal with Italian Shoah, around half of the victims were either arrested, detained or dead in Italy, but were originally from other countries. In many cases, for example for many French and Eastern European Jews, Italy was the country where they fled in the hope to escape from Nazi threat, while others lived in Italian possessions that, after the Armistice of Cassibile, were occupied by German troops.
Victims' fate is described by the value of death_description property, used as a filter in the application. We report in some statistics extracted with the help of LOD Navigator: sadly, the great majority of victims in the database (84.2%) died in an extermination camp, and only 12% survived the Shoah.
We also show in the locations displayed in the Navigator interface that are more frequently associated with specific events. Each row in the table can be explained by connecting it to the history of Jewish communities in Italy and in Europe in the XX Century. For example, many victims were born in Rome, Trieste and Venezia, because at the time they had the largest Jewish communities in Italy. Rhodes was also the birthplace of many victims, because it had been under Italian control since 1912 and in the 1920s the local Jewish community was very important, including around one-third of the total population. Rhodes is also the place witnessing the highest number of arrests (1,758 out of 7,960), confirming that the Shoah led to the deportation and the death of most of the community members. Despite being a small city, also Borgo San Dalmazzo is among the places where most of the arrests were carried out. This is because it hosted a Nazi concentration camp, where foreign-born Jews from France were arrested trying to escape the Vichy regime. Also Fossoli is just a small village in Emilia Romagna, but it was the place of detention for most of the recorded victims because there was a transit camp where Jews were detained before being sent to Auschwitz. The latter is the camp where most of the victims in CDEC database were deported and died. In addition to two other extermination camps (i.e., Monowitz and Flossenburg), many Jews died in massacres as in Rome (Fosse Ardeatine) and at Lake Maggiore. Information about the return after liberation is available only for 136 people. The proportion between Shoah victims that were born in Rome and those that returned to the city after liberation (1,526 vs. 86) shows, as an eloquent example, the impact of this tragedy on local Jewish communities.
death_description
QUANTITY
Dead in extermination camp
7,333
Survivor of Shoah
1,037
Dead in massacre
202
Dead in custody
70
Unknown
28
Dead en route to camp
15
Committed suicide
10
Dead of hardships and privations
6
Killed in escape attempt
6
Missing
6
Killed during arrest
1
TOTAL
8,712
Division of victims on the basis of the death_descriptionproperty
EVENTS
#
TOP 5 PLACES
Birth
8,340
Roma (1,526) - Rhodes (1,524) - Trieste (466) - Vienna (205) - Venezia (200)
Arrest
7,960
Rhodes (1,758) - Roma (1,712) - Trieste (509) - Borgo San Dalmazzo (329) - Milano (241)
Detention
7,873
Fossoli (2,699) - Rhodes (1,712) - Roma (1,029) - Milano (872) - Trieste (661)
Auschwitz (3,743) - Roma (81) - Monowitz (57) - Lago Maggiore (50) - Flossenburg (38)
Return after Liberation
136
Roma (86) - Milano (32) - Torino (7) - Tripoli (4) - Livorno (2)
TOTAL
37,355
Number of events dated and georeferenced in the LOD Navigator together with the five most frequent locations for each event
Conclusions and Future Works
In this paper we have presented the LOD Navigator, an example of digital history application, whose contribution is manifold: it provides for the first time an interactive system, through which part of the data collected by CDEC can be browsed, searched and visually displayed on a map. This can benefit the community of researchers interested in studying the Shoah but also the Jewish community and the broad public. We believe that the main innovative idea of the LOD Navigator is to visually track movements that, when available only in LOD or plain text, do not give the possibility to get an overview or to interact with the data. It addresses the needs of researchers and scholars but also of the families involved in deportations and all the Jewish community to support their effort in reconstructing stories of families and losses during the Shoah. Besides, the navigation system is data-independent and can be used to view other trajectories by uploading a simple JSON file containing georeferenced places and dates, thus providing a useful tool to (digital) history scholars at large: for example, in Menini et al. , a preliminary version of the interface was adopted to trace the motion trajectories automatically extracted from Wikipedia biographies with the aim of providing important data for the analysis of culture and society.
As for future work, many possible developments can be envisaged. First of all, we plan to release a web-based version of the application to facilitate data navigation without requiring any installation. From the point of view of the visualization, it would be important to find an efficient way to deal with uncertainty. Indeed, some dates and places in the database are stored as uncertain (associated with a question mark), thus it would be important to visually display this lack of confidence. Moreover, new filters could be added for example to allow searching for specific events (e.g. to display only movements related to the detention event). Another interesting extension would be to include information about family relations present in the CDEC digital library, so to trace trajectories at family level and take advantage of our tool's interactivity to easily spot whether its members followed the same path or were separated in one of the stages of persecution . An additional effort should also be made to evaluate the usability and effectiveness of the tool, both explicitly with a questionnaire and implicitly by tracking the searches performed by users, similar to the evaluation presented in . Looking at our application in a long-term perspective, we envisage the extension of current input data with other information taken from similar databases developed in other Nations or from documents in plain text . This would be a crucial step to extend the potential of LOD Navigator to the story of other Jewish communities , .
Acknowledgements
We wish to thank Laura Brazzo (CDEC) and Silvia Mazzini (regesta.exe) for publicly sharing the data that we used to develop our application.
References
Moretti, Giovanni, Rachele Sprugnoli, Stefano Menini and Sara Tonelli. 2016. ALCIDE: Extracting and visualising content from large document collections to support humanities studies.Knowledge-Based Systems 111, pp. 100-112.
Brazzo, Laura and Silvia Mazzini. 2015. From the Holocaust Victims Names to the Description of the Persecution of the European Jews in Nazi Years: the Linked Data Approch and a New Domain Ontology.Book of abstract of DH 2015.
Brazzo, Laura and Silvia Mazzini. 2017. Linked Open Data per l'analisi dei dati e lo sviluppo della ricerca sulla Shoah in Italia. In Quaderni di Umanistica Digitale, AIUCD2017 - Book of Abstracts. DOI 10.6092/unibo/amsacta/5885.
Menini, Stefano, Rachele Sprugnoli, Giovanni Moretti, Enrico Bignotti, Sara Tonelli and Bruno Lepri. 2017. Ramble on: tracing movements of popular historical figures.Proceedings of the Software Demonstrations of the 15th Conference of the European Chapter of the Association for Computational Linguistics, pp. 77-80.
Beorn, Waitman, Tim Cole, Simone Gigliotti, Alberto Giordano, Anna Holian, Paul B. Jaskot, Anne K. Knowles, Marc Masurovsky and Erik B. Steiner. 2009. Geographies of the Holocaust.Geographical Review 99/4, pp. 563-574.
Giordano, Alberto and Anna Holian. 2014. Retracing the 'hunt for jews': A spatio-temporal analysis of arrests during the holocaust in Italy. In Geographies of the Holocaust. Knowles, Anne K., Tim Cole and Alberto Giordano (eds.). Bloomington: Indiana University Press.
Knowles, Anne K., Tim Cole and Alberto Giordano (eds.). 2014. Geographies of the Holocaust. Bloomington: Indiana University Press.
Stone, Dan. 2016. Holocaust Spaces. In Hitler's Geographies. The Spatialities of the Third Reich. Giaccaria, Paolo and Claudio Minca (eds.). Chicago: University of Chicago Press, pp. 45-62.
Knowles, Anne K., Levi Westerveld and Laura Strom. 2015. Inductive visualization: A humanistic alternative to GIS.GeoHumanities ½, pp. 233-265.
Picciotto Fargion, Liliana. 1991. Il libro della memoria. Gli ebrei deportati dall'Italia (1943-1945). Milano: Mursia.
Palmero Aprosio, Alessio and Claudio Giulian. 2016. The Wiki Machine: an open source software for entity linking and enrichment. ArXiv e-prints.
Palmero Aprosio, Alessio and Sara Tonelli. 2015. Recognizing Biographical Sections in Wikipedia.Proceedings of the 2015 Conference on Empirical Methods in Natural Language Processing, pp. 811-816.
Brodlie, Ken, Rodolfo A. Osorio, and Adriano Lopes. 2012. “A review of uncertainty in data visualization.” In Expanding the frontiers of visual analytics and visualization. Dill, John, Rae Earnshaw, David Kasik, John Vince, Pak Chung Won (eds.). London: Springer, pp. 81-109.
Perego, Simon. 2013. Du CDJC au Centre de documentation du Mémorial de la Shoah, 1943-2013: documenter le génocide des Juifs d'Europe.Histoire@ Politique 1, pp. 269-282.
Vashem, Yad. The Central Database of Shoah Victims' Names, https://yvng.yadvashem.org/
Hilberg, Raul. 1985. The destruction of the European Jews. New York: Holmes & Meier.
Dadrian, Vahakn. 2004. Patterns of twentieth century genocides: the Armenian, Jewish, and Rwandan cases.Journal of Genocide Research 6/4, pp. 487-522.
Giaccaria, Paolo and Claudio Minca (eds.). 2016. Hitler's Geographies. The Spatialities of the Third Reich. Chicago: University of Chicago Press.