Questa indagine riguarda le conoscenze digitali di studenti universitari, nativi digitali di ultima generazione, iscritti a corsi in materie umanistiche, in cui le competenze digitali e l’informatica rischiano spesso di passare in secondo piano sia per quanto riguarda l’interesse degli studenti sia nell’offerta formativa. L’obiettivo è capire come gli studenti percepiscono il proprio livello di competenza digitale e se esista una discrepanza tra il livello percepito tramite autovalutazione e la conoscenza effettiva. Gli studenti hanno perciò risposto a un sondaggio di quattro sezioni contenenti domande conoscitive, due sezioni di autovalutazione e una comprendente domande a risposta multipla, basate sul Quadro Europeo delle Competenze Digitali, su aspetti pratici e teorici del lavoro al computer utili in ambito universitario e professionale. I risultati evidenziano che i partecipanti tendono a sopravvalutare le proprie competenze e che le loro conoscenze presentano diverse lacune anche su aspetti basilari. Oltre che per tracciare il profilo delle capacità digitali degli studenti universitari, il sondaggio indica quali conoscenze, spesso date per assodate da docenti e istituzioni, dovrebbero invece essere potenziate per fornire agli studenti strumenti adeguati ad affrontare il loro percorso accademico e, più avanti, quello professionale, ma anche l'uso quotidiano degli strumenti digitali.
This paper presents a study carried out to survey the digital skills of Italian students belonging to the latest generation of digital natives and currently enrolled in university courses of humanities, in which IT and digital skills risk to be neglected both by the students’ interest and the range of courses that are offered. The study aims to understand how students perceive their level of digital skills and whether there is a discrepancy between their self-assessed level and their actual knowledge. Participants answered a survey of four sections, including preliminary questions, two self-assessment parts and a section containing multiple-choice questions, based on the European Framework of Digital Competences, on both theoretical and practical aspects of IT and digital skills. Results show that participants tend to overestimate their digital skills and that they lack knowledge of basic topics. Besides outlining the digital competences of Italian humanities students, this study points out digital skills that should be strengthened, whereas they are often taken for granted by teachers and institutions, although students need those skills in their university and professional life, but also for their daily digital needs.
Introduction
In his infamous work Digital Natives, Digital Immigrants, published in 2001, Mark Prensky states that our students today are all “native speakers of the digital language of computers, video games and the Internet” () and defines them ‘digital natives’. At first, the term indicated the first generation born and raised after the spread of digital technologies (i.e. after 1980) such as computers, video games, digital music players, video cams, cell phones, and all the other toys and tools of the digital age (), and the term is still commonly used today to designate younger generations that always lived in contact with digital tools. There is a misleading assumption that generations born and raised in a digital environment are naturally skilled that might lead to overestimating the digital skills of digital natives. However, “in the seminal literature on digital natives these assertions are put forward with limited empirical evidence (e.g. ) or supported by anecdotes and appeals to common-sense beliefs ()” (). According to the same authors, literature demonstrates a clear mismatch between the confidence with which claims are made and the evidence for such claims.
Indeed, living with digital tools and using them daily does not necessarily determine tech-savviness, as confirmed by several studies. Italian students belonging to the digital native generation are not an exception. According to a study carried out in Italian schools, 14-16-year-old Italian students can perform more technical and procedural activities using computers, although they have very low skills in more complex tasks such as using logical operators or distinguishing between tasks that can be accomplished or not by computers (). More importantly, the same study found that the sample does not spontaneously doubt the reliability of Internet information, a much-needed skill in the era of fake news. Furthermore, an OECD-PISA survey found out that Italian students do not learn how to plan and execute a search, how to evaluate the usefulness of information, or how to assess the credibility of sources and they seem to receive little help from Italian schools in developing those increasingly important skills (). Additionally, Italian university students have “an erroneous perception of the level of IT security knowledge, even amongst respondents studying technical subjects” (). Finally, the ISTAT 2019 () report found out that 41.6% of Italian Internet users have low digital skills.
Although the aforementioned studies were carried out mainly with Italian teenagers, it can be assumed that students enter university with lacks in their digital skills. In the digital turn in higher education () is therefore important to identify them to assess the actual level of knowledge and plan better teaching syllabi according to the results.
The survey
This study explores the digital skills of university students born after 1993 and currently attending humanities courses in Italy. Indeed, in such courses students often seem not particularly interested in digital skills and ICTs (information and communication technologies), that can be limited or even neglected in the range of courses offered by universities. In other cases, applied IT courses (applied to humanities, to translation, courses on digital humanities applications, practical courses on specific software, etc.) are offered, but they do not focus on basic IT and digital skills. Nonetheless, digital skills are nowadays fundamental (or, at least, extremely helpful) in any field of knowledge, and required for most jobs. It is therefore important to understand the students’ level of knowledge to determine which skills, useful at an academic, professional, but also personal level, should be strengthened during the students’ training.
For this study, students born after 1993 were considered as, first of all, they represent the generation currently enrolled in both bachelor’s and master’s degrees in Italy. Furthermore, students born after 1993 are often referred to as the ‘Google generation’ () or ‘i-Generation’ and are often considered the ‘actual’ digital natives since they have grown up in a Web 2.0 environment ().
The aims of the survey are:
outlining the digital skills profile of Italian university students of humanities;
understanding if there is a discrepancy between their self-assessed level of digital skills and the actual level of knowledge;
identifying specific skills that should be improved in order to give students better tools for their academic, personal and professional use of digital tools.
Structure
The survey is divided in four parts. The first part contains preliminary questions to outline the profile of the respondents. First, it contains general questions aimed to understand the demographics of respondents (year of birth, gender, region of origin, university, degree course, etc.). The following questions focus on the ‘user profile’ of participants, including how long they have been using computers and the Internet, if they own a computer, which operating system they use, which device they use more often. There are also questions regarding their attitude towards ICTs and the digital world that investigate if participants are interested in them and if they have ever fixed or changed a computer part (such as RAM, internal hard disk, video card, etc.). Then, participants are asked if they got an ECDL certification, if they feel that they know more about computers than their high school/university teachers, and finally if they help friends and family to solve their problems with their devices.
The second section includes a single self-assessment question that asks participants to place their skills on a 5-grade scale going from insufficient to excellent without giving further details. The goal of this section is to understand how participants evaluate their skills overall. Moreover, its results will be compared to the answers to the following section.
The third section contains a second self-assessment set of questions based on the European Digital Competence Framework 2.0 (DigComp). The framework identifies the key components of digital competence in five areas, described as follows:
Information and data literacy: To articulate information needs, to locate and retrieve digital data, information and content. To judge the relevance of the source and its content. To store, manage, and organise digital data, information and content.
Communication and collaboration: To interact, communicate and collaborate through digital technologies while being aware of cultural and generational diversity. To participate in society through public and private digital services and participatory citizenship. To manage one’s digital identity and reputation.
Digital content creation: To create and edit digital content To improve and integrate information and content into an existing body of knowledge while understanding how copyright and licences are to be applied. To know how to give understandable instructions for a computer system.
Safety: To protect devices, content, personal data and privacy in digital environments. To protect physical and psychological health, and to be aware of digital technologies for social well-being and social inclusion. To be aware of the environmental impact of digital technologies and their use.
Problem solving: To identify needs and problems, and to resolve conceptual problems and problem situations in digital environments. To use digital tools to innovate processes and products. To keep up-to-date with the digital evolution.
Participants are asked to read the descriptions of the framework levels as they appear in the EuroPass CV self-assessment of digital competencies and choose to which level they feel they belong for each area (basic, independent or proficient user). Two more options are added and participants can also choose I am not competent enough and I do not fit in any of the levels listed above or “I am more competent than all the levels listed above”.
Finally, the fourth section represents the core of the survey. It comprises fifteen multiple-choice questions that try to investigate the actual knowledge of participants. The questions are based on the European Framework and refer to theoretical and practical aspects of working with IT and digital tools. They include the following topics:
1) Definition of RAR files;
2) Creation of PDF files;
3) Identification of mark-up languages;
4) Identification of hardware items;
5) Definition of DuckDuckGo (alternative search engine);
6) Identification of reliable websites containing news/information;
7) Identification of encrypted websites;
8) Functioning of ‘allinurl:’ on Google;
9) Privacy of content on social media;
10) Password management;
11) Reaction to phishing e-mails;
12) Understanding of how search engines work;
13) Sending big files;
14) Sharing documents with others;
15) Solving problems related to safety (viruses, spyware, etc.).
All the questions have four or more answers, always including an I don’t know option, and some had more than one correct answer. For example, the question Which of the following items are hardware? lists the following answers, with four correct options (hard disk, printer, SSD memory device, HDMI cable):
hard disk
operating system
printer
SSD memory device
cloud computing
HDMI cable
browser
IP address
I don’t know
Some trick answers are present to ‘mislead’ participants and assess their actual knowledge on certain topics. For example, answers to the question “Which of the following are safe (encrypted) websites?” are:
https://www.pornhub.com
http://units.it/
https://musicagratis.ita
http://mail.google.com
https://www.unicredit.com
The correct answers are, of course, the URLs containing the ‘https’ protocol, whereas the second level domains (meaning the names preceding .it, .ita or .com) used here might trick respondents because they can be associated to safe or malicious websites.
A similar technique is used in the question Which of the following contain reliable information?:
Il fatto quotidaino
Facebook
ANSA
Wikipedia
Corriere della Sera
ReteNews24
Treccani
While three of the listed sources are reliable (Corriere della Sera, ANSA, and Treccani), Il fatto quotidaino and ReteNews24 were popular fake news websites. The former mimicked the Italian newspaper Il fatto quotidiano (note the imperceptibly reversed vowels), the latter recalls a TV news channel named Rainews24.
Distribution
The survey was distributed through social media by posting its URL on 47 Facebook groups of Italian universities, with a focus on departments and degree courses of humanities.
Respondents answered anonymously. The system registered responses from 411 participants coming from 27 Italian universities and enrolled in several degree courses of humanities including languages, literature, translation and interpreting, art, history, philosophy and so on.
Results
Responses were collected between November 2018 and January 2019 and were later filtered by using a Python script that discarded the incomplete ones and excluded respondents who did not meet the requirements of being born after 1993 or enrolled in a relevant degree. The filtering process resulted in 270 valid responses. Another Python script automatised the data processing phase, and to weigh the answers registered in section 4 of the survey. Every right answer gave 1 point if correct, or 0.5 points for answers that can be considered partially correct. Wrong answers corresponded to -1 or -0.5 point, and not answered questions or I don’t know answers mark 0 points. The maximum possible score is 28 points.
After calculating the results, an R script automatically generated charts and graphs.
The overall result is quite complex and several correlations between data can be made, however, only the most relevant ones will be discussed here.
Profile
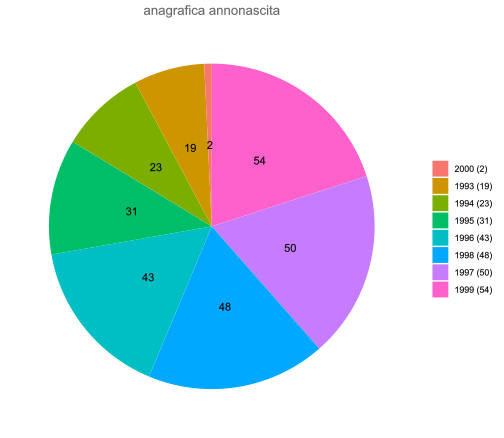
First of all, the preliminary questions of the first section found that respondents are mostly female (234 out of 270). Their years of birth range from 1993 to 2000 and are distributed as shown in .
Years of birth of the respondents
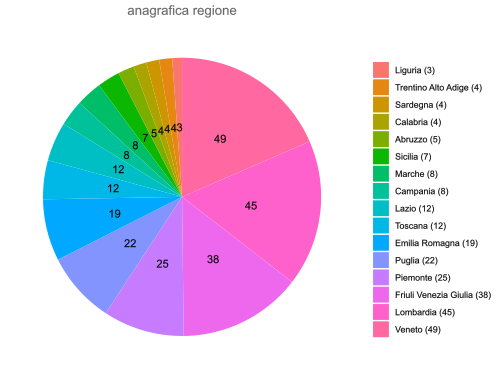
Most participants come from the Northern regions of Italy, especially Veneto (49 respondents), Lombardy (45), and Friuli-Venezia Giulia (38), that virtually cover half of the sample. Other regions can be seen in the chart in .
Regions of origin of the respondents
Gender and origin are interesting starting data that might play a role in the performance of the participants in this survey. Indeed, according to studies, there is a digital divide between male and female users, with the latter showing a disadvantage. On the other hand, respondents come mainly from the Northern part of Italy, less affected by regional digital divide ().
213 students are currently enrolled in a bachelor’s degree, with several degrees represented (translation, interpreting, languages, history, philosophy, literature, art, pedagogy…). Many of them are attending the University of Trieste (89), whereas Milan ranks second (29) and Bologna third, with 25 respondents. Less than half (117) already attended an IT course at university, although age and the fact that many respondents are enrolled in the first year of university must be considered in this case. Only 57 respondents have an ECDL certification.
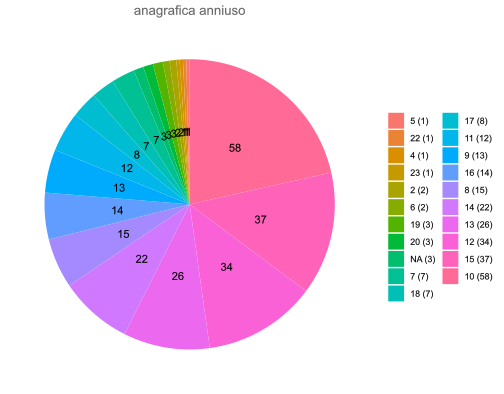
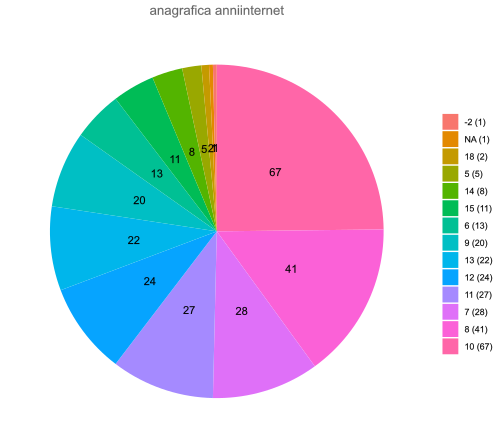
and shows the years of usage of computers and the internet respectively.
Years of usage of computers.
Years of usage of the Internet.
As the charts show, the majority of respondents have been using computers for at least ten years, whereas they have been generally surfing the Internet for less time.
Almost all the respondents own a computer (260), of which 220 use Windows, 22 MacOS, and 2 Linux as their operating system. Laptops seem to be the most used device according to 196 respondents, while smartphones are preferred by 96, tablets by 10, desktop computers by 6, and other devices by 2. Devices are mostly used for studying (200), entertainment (7), communication (2) and work (1).
Almost two-thirds of the respondents declare that they are not interested in ITC (174), and 212 have never tried to change a computer part. The majority of participants still believe that they are more expert than their high school teachers (222), whereas fewer respondents think that they are more expert than their university teachers (170). Finally, three out of four respondents (203) help their friends and family if they have any issues with their devices.
First self-assessment
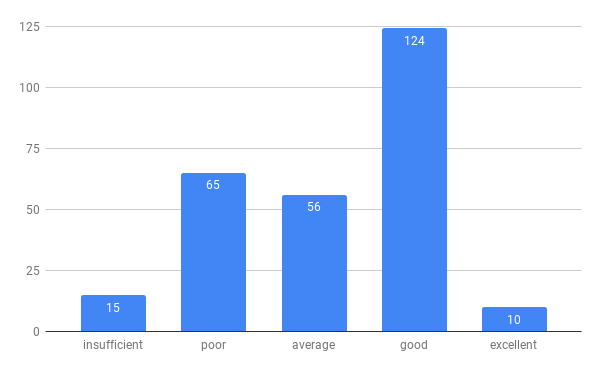
When asked to measure their knowledge on a 5-grade scale including insufficient, poor, average, good, and excellent, respondents answered as illustrated in the graph in .
Self-assessed overall level of digital skills
Almost half (124) answered that their knowledge is good, with ‘good’ being the second-top grade of the scale. 65 think that their knowledge is average, 56 that it is poor, 15 that it is insufficient and 10 that it is excellent. It can therefore be assumed that respondents generally believe that their level of skills is high but not perfect, while many are aware of their low-level skills.
Second self-assessment based on the DigComp framework
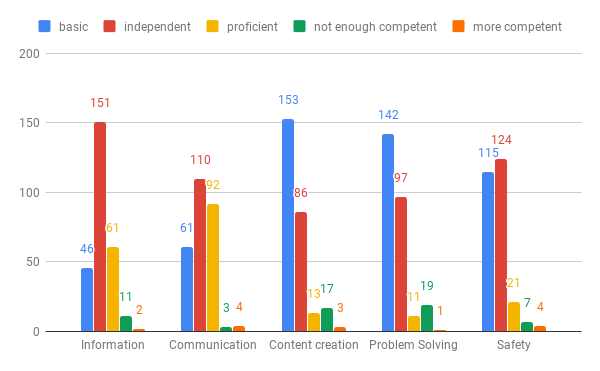
While students seem to have a quite good overall opinion about their skills, the third section of the survey shows a slightly different picture. Indeed, the descriptions used in the European Digital Competence Framework 2.0 give more contextualised definitions of what digital skills are and how they can be evaluated. Responses to this section are summarised in .
Respondents' DigComp self-assessed levels
More than half feel that their description corresponds to the independent user one when it comes to information and data literacy. 61 respondents feel proficient, and 11 respondents feel less competent than the described profiles. Only 46 consider themselves basic users.
Respondents feel even more self-confident in the communication area. As easily predictable in the communication era, the vast majority of respondents seem to be quite positive about their skills, with 110 independent, 92 advanced, and 61 basic users.
On the contrary, the self-assessed level in the content creation area appears quite different, as most respondents (153) declare to be basic users, while 86 are independent users. According to 17 respondents, their skills are too low and they do not fit in any of the descriptions. Finally, only 13 users are proficient.
A similar scenario appears in the problem solving area. Indeed, as in the previous area, most respondents (142) are basic users, 97 are independent users, 19 are extremely-low-skilled users, whereas only 11 are proficient.
Finally, in the safety area, the majority of respondents are independent users. However, almost the same amount of respondents declare to be basic users, whereas 21 are proficient.
In the first self-assessment phase (section 2 of the survey), almost half of the respondents reported having a ‘good’ level of skills, which might correspond to an independent to proficient user profile. However, the participants’ self-perceived level downsized simply by giving them a more punctual definition of the areas connected with digital skills. Although in two areas out of five (content creation and problem solving) basic users prevail, respondents still perceive that their level of skills is good. It is also interesting to note that some users believe that their level is so low that it does not correspond to any of the profiles described in the European Framework.
Multiple-choice questions
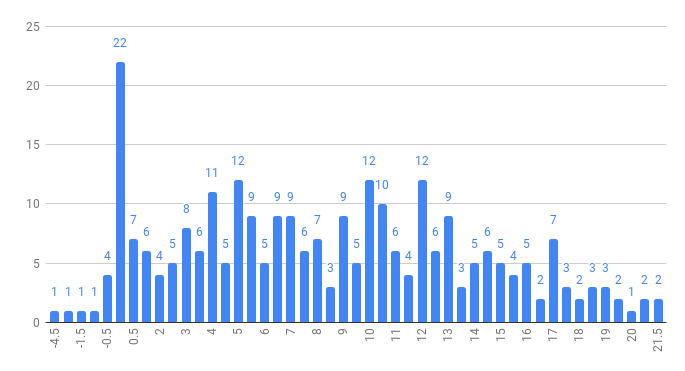
As mentioned, the fourth section represents the core of this survey and comprises fifteen multiple-choice exploratory questions that test the actual knowledge of the participants. The questions are based on the five areas of the European Framework and refer to theoretical and practical aspects of working with IT and digital tools. Answers were weighed using a scoring system (+1 or +0.5 to correct answers, -1 or -0.5 wrong answers, and 0 points for empty or I don’t know answers), with the maximum possible score corresponding to 28 points. The respondents obtained the scores represented in .
Respondents' scores
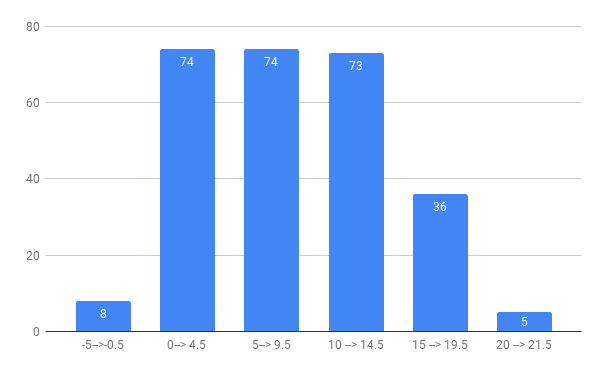
Although only few respondents reach a negative score, the graph shows a peak on 0, with 22 respondents who obtained that mark. The score distribution is clearer in , representing the scores divided into 5-point ranges.
Respondents' scores represented in 5-point ranges
The graph demonstrates that more than half of the scores (about 55%) concentrate between 0 and 10 points. Moreover, only 5 respondents got a score higher than 20 points and no one reached the maximum score of 28.
The high incidence of 0 scores could suggest that respondents often resorted to the I don’t know option. Although 222 out of 270 respondents answered I don’t know at least once while filling out the survey, I don’t know answers represent only 14% of the total given answers. Low scores are therefore caused mainly by incorrect answers.
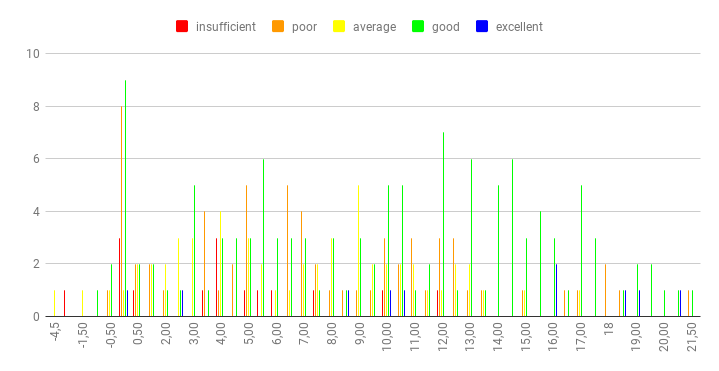
shows how respondents scored according to their first self-assessment.
Scores according to the respondents' first self-assessment
Self-declared ‘good’ users still peak on 0 points, while several ‘excellent’ users got low marks. The graph suggests that many users tend to overestimate their skills, except for a ‘poor’ user reaching one of the highest scores.
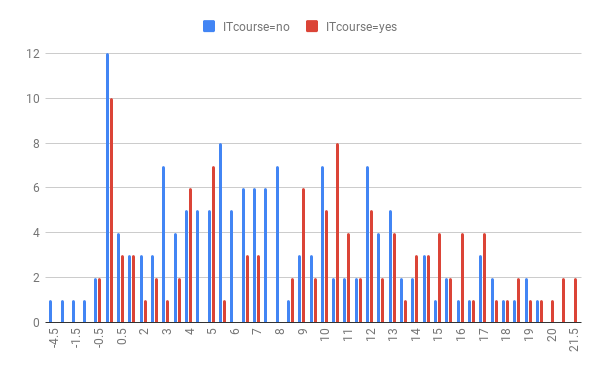
Respondents who already took an IT course at university show slightly better results, as shown in .
Scores represented according to whether participants already took an IT course at university
Note that all the highest scores were reached by students who already took a course. Nonetheless, most still get low results, which might suggest that IT courses currently offered help but are still not enough to enhance many skills described in DigComp.
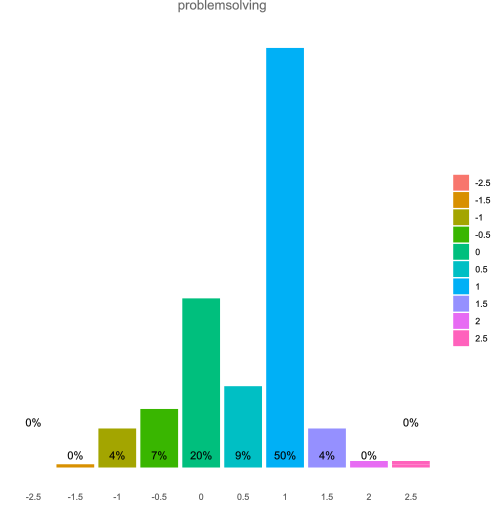
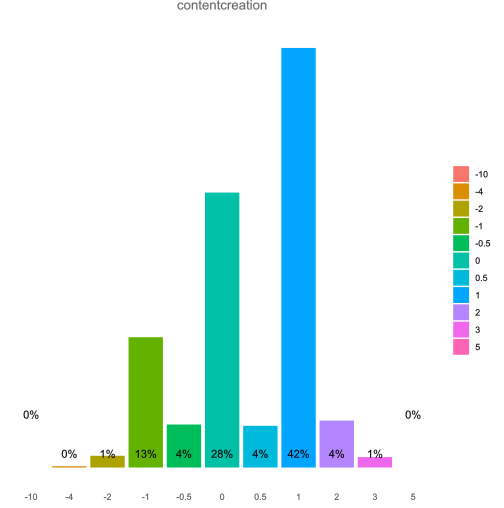
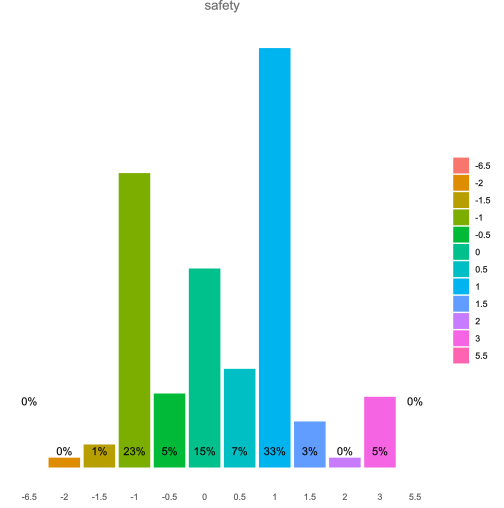
Scores can also be analysed by categorising them according to DigComp, as shown in the following figures, in order to identify the most problematic areas.
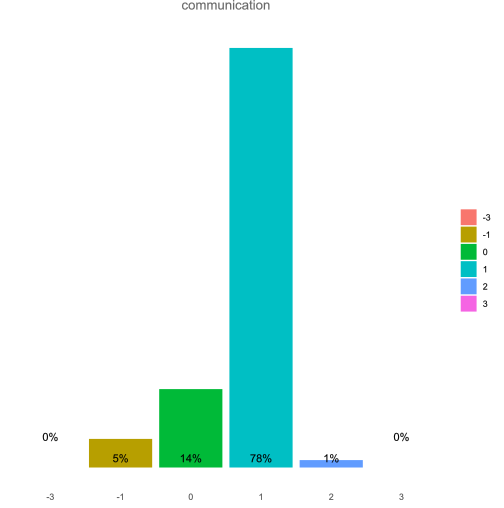
Scores referred to the DigComp communication area
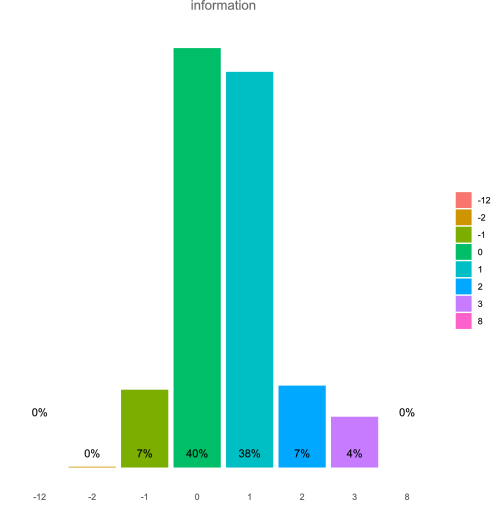
Scores referred to the DigComp information area
Scores referred to the DigComp problem solving area
Scores referred to the DigComp content creation area
Scores referred to the DigComp safety area
Respondents seem to lack knowledge in all the areas, as they generally score low or even negative. The most problematic area is the information-related one. Indeed, few respondents got 3 points while the maximum score is 8. Although most respondents declared to be independent users, they seem to lack knowledge in the safety area, where they got several negative marks and never reached the maximum of 5.5 points. Moreover, despite the fact that participants seemed very confident in the DigComp self-assessment section regarding the communication area, they showed some gaps in their knowledge, and 78% reached a score of 1 while the maximum score is 3.
Finally, it is interesting to analyse some striking answers to single questions. For instance, 88 respondents out of 270 reported that they do not know what a .rar file is. Only 53 indicated correctly that ‘allinurl:’ on Google is an operator to narrow search queries but 173 do not know what it is, and this probably indicates that they do not know any of the advanced search operators all ending with a colon that can be specified in the Google search bar. The meaning of ‘https’ seems clear to 43 respondents who chose all three correct answers. Only 8 identified correctly all the listed mark-up languages, while 97 out of 270 identified HTML and only 15 know that LaTeX is a mark-up language. It is also surprising to see that most students do not even understand a basic concept as the differences between hardware and software. While 171 correctly indicated that hard disks belong to hardware (possibly because of the two sounding similar), 49 consider operating systems as hardware, and 53 do not know. No one checked all the correct answers in the question.
Conclusion
This exploratory study was conducted on a diverse sample, although not statistically significant. However, it still gives some ideas on how Italian university students of humanities perceive their skills, whether they lack some competencies, and whether there is a gap between their self-assessed level of knowledge and the actual one. Indeed, there is still a need for further studies involving other populations, as well as a more extensive and more balanced set of questions including other topics.
Students of humanities who participated in this study have a very good opinion about their digital skills: most of them consider themselves ‘good’ users overall, and ‘independent’ users in three out of five DigComp areas. However, when tested, they showed significant gaps in their knowledge in all the areas, indicating that they tend to overestimate their skills, as a study published by the ECDL Foundation () already stated. In particular, the areas related to safety and information are problematic. Furthermore, while students feel very confident in their communication digital skills, they seem to be lacking knowledge in this field, too. As argued by Selwyn () many young peoples’ actual use of digital technologies remain rather more limited in scope than the digital native rhetoric would suggest.
When thinking that their skills are good or even excellent, students are not motivated to strengthen them as they do not feel the need to. Furthermore, they do not understand the potential of using digital skills in their everyday, academic, and work life. This can also be one of the reasons why they tend to overestimate their skills, as they do not know the potentialities of using digital tools and do not perceive any gap in their knowledge.
There are also other risks associated with the fact that digital skills are taken for granted. For example, teachers will not feel the need to teach basic aspects and will rather go for more advanced ones, employers will still expect their employees to have certain digital skills, maybe the ones declared on their CVs based on a self-assessment like DigComp, and governments will not allocate enough resources as they do not feel the urge to do so.
Nonetheless, digital skills are gaining importance and represent a key factor in every aspect of our lives. It is therefore important to reconsider how digital skills are passed down to younger generations in order to avoid a future gap.
There is a need to rethink how digital skills are taught, first of all, in early education, then in humanities (and other) courses, besides finding effective ways to assess them and to make students more self-aware. Another issue is the lack of interest that this study found, which can compromise the students’ will to improve their knowledge.
A good starting point for humanities courses could be considering to enhance basic IT/digital courses before applied ones in order to improve fundamental skills before giving students more advanced tools. Demonstrating that the skills that students acquire can actually help them to work better and more efficiently might help to spark their interest in the subject.
Acknowledgements
I thank Luca Tringali, programmer and specialised journalist, for his valuable help with R and Python and throughout all the phases of this study.
References
Bennett, Sue, Karl Maton and Lisa Kervin. 2008. The “Digital Natives Debate: A Critical Review of the Evidence.” British Journal of Educational Technology 39 (5):775–786.
Calvani, Antonio, Antonio Fini, Maria Ranieri, and Patrizia Picci. 2012. Are Young Generations in Secondary School Digitally Competent? A Study on Italian Teenagers.Computers & Education 58 (2):797–807. https://doi.org/10.1016/j.compedu.2011.10.004.
Cooper, J. 2006. The Digital Divide: The Special Case of Gender: The Digital Divide.Journal of Computer Assisted Learning 22 (5):320–34. https://doi.org/10.1111/j.1365-2729.2006.00185.x.
Csernoch, Maria, and Piroska Biró. 2019. Are Digital Natives Spreadsheet Natives?ArXiv:1909.00865 [Cs], September. http://arxiv.org/abs/1909.00865.
Davaki, Konstantina. 2018. The Underlying Causes of the Digital Gender Gap and Possible Solutions for Enhanced Digital Inclusion of Women and Girls - Think Tank. 2018. https://www.europarl.europa.eu/thinktank/en/document.html?reference=IPOL_STU%282018%29604940.
ECDL Foundation. 2015. The Fallacy of the “Digital Native: Why Young People Need to Develop Their Digital Skills.” https://ec.europa.eu/futurium/en/system/files/ged/the_fallacy_of_the_digitalnative_-_ecdl_foundation.pdf.
ECDL Foundation. 2018. Perception & Reality - Measuring Digital Skills Gaps in Europe, India and Singapore. http://ecdl.org/media/perception__reality_report_-_ecdl_foundation_-_2018_1.pdf.
Engen, Bård-Ketil, Tonje Giæver, Greta Björk Gudmundsdottir, Ove Hatlevik, Louise Mifsud, and Karoline Tomte. 2014. “Digital Natives: Digitally Competent?" In Proceedings of SITE 2014--Society for Information Technology & Teacher Education International Conference, ed. by M. Searson & M. Ochoa, 2110–16. Association for the Advancement of Computing in Education (AACE). https://www.learntechlib.org/primary/p/147293/.
Helsper, Ellen. 2008. “Digital Natives and Ostrich Tactics?: The Possible Implications of Labelling Young People as Digital Experts. Bristol: Futurelab. http://www.beyondcurrenthorizons.org.uk/.
ISTAT. 2019. ‘Cittadini e ICT’. https://www.istat.it/it/archivio/236920.
Jackson, Linda A., Yong Zhao, Anthony Kolenic, Hiram E. Fitzgerald, Rena Harold, and Alexander Von Eye. 2008. Race, Gender, and Information Technology Use: The New Digital Divide.CyberPsychology & Behavior 11 (4):437–42. https://doi.org/10.1089/cpb.2007.0157.
Kergel, David, Birte Heidkamp, Patrik Kjærsdam Telléus, Tadeusz Rachwal, and Samuel Nowakowski, eds. 2018. The Digital Turn in Higher Education. Wiesbaden: Springer Fachmedien Wiesbaden. https://doi.org/10.1007/978-3-658-19925-8.
Kirschner, Paul A., and Pedro De Bruyckere. 2017. The Myths of the Digital Native and the Multitasker.Teaching and Teacher Education 67 (October):135–42. https://doi.org/10.1016/j.tate.2017.06.001.
Li, Yan, and Maria Ranieri. 2010. Are “Digital Natives Really Digitally Competent?-A Study on Chinese Teenagers: Chinese Teenagers’ Digital Competence.” British Journal of Educational Technology 41 (6):1029–42. https://doi.org/10.1111/j.1467-8535.2009.01053.x.
Lokar, Alice, Stefano Ondelli, Fabio Romanini, and Elia Silvestro. 2018. Credibile ma falso. Come riconoscere le fake news (quasi senza leggerle). Trieste: EUT Edizioni Università di Trieste. https://www.openstarts.units.it/handle/10077/22409.
McShane, Ian, Mark A Gregory, and Christopher Wilson. 2016. Practicing Safe Public Wi-Fi: Assessing and Managing Data-Security Risks.SSRN Electronic Journal. https://doi.org/10.2139/ssrn.2895216.
OECD. 2015. Students, Computers and Learning: Making the Connection. PISA. https://doi.org/10.1787/9789264239555-en.
OECD. 2018. Bridging the Digital Gender Divide: Include, Upskill, Innovate. https://www.oecd.org/going-digital/bridging-the-digital-gender-divide-key-messages.pdf.
Prensky, Marc. 2001. Digital Natives, Digital Immigrants Part 1.On the Horizon 9 (5):1–6. https://doi.org/10.1108/10748120110424816.
Rowlands, Ian, David Nicholas, Peter Williams, Paul Huntington, Maggie Fieldhouse, Barrie Gunter, Richard Withey, Hamid R. Jamali, Tom Dobrowolski, and Carol Tenopir. 2008. The Google Generation: The Information Behaviour of the Researcher of the Future. In Aslib Proceedings, 60:290–310. Emerald Group Publishing Limited.
Selwyn, Neil. 2009. The Digital Native – Myth and Reality.Aslib Proceedings 61 (4): 364–79. https://doi.org/10.1108/00012530910973776.
Tapscott, Don. 1998. Growing Up Digital: The Rise of the Net Generation. New York: McGraw-Hill.
Tech and Law Center. 2014. Security of the Digital Natives.
Also see for more ‘myths’ regarding digital natives.
See, among others, , ; ; . Other data are reported in .
The data set, including complete responses, graphs, Python and R scripts, can be found at https://github.com/flometis/informaggio (last consulted on 07/09/2019)
Those courses are undoubtedly useful. However, they often require some previous knowledge that students do not have. For instance, in my experience as a teacher of IT applied to translation, I have noticed that students do not have any previous knowledge of file formats, encodings, OCR, text formatting, ‘conscious’ Google searches: all useful tools when it comes to compile corpora, tag them, or use CAT (computer-assisted translation)-tools. Students even struggle with standard software interfaces or keyboard shortcuts, which suggests that they are not very familiar with using those tools.
The first part also contains what software developers and videogamers would call an ‘Easter egg’. The privacy note at the beginning of the survey asked participants to write Accept in the text box and listed a Read more option. It contained more details about the privacy policy, but also a part that stated If you read this, please write ‘read’ instead of ‘accept’ in the text box, otherwise you shall give a case of IPA beer to the administrator of this survey. Out of all the participants only one spotted the Easter egg by underlining that a case of IPA is an ambiguous reference for a linguist, so now I should have 269 IPA cases in my fridge. With regard to this, see the experiment ran by F-Secure (described in ) concerning free WiFi terms and conditions. The team set a free hotspot, but customers where asked to sign terms and condition that contained the Herod clause, stating that the recipient agreed to assign their first born child to us for the duration of eternity.
ECDL is the European Computer Driving Licence, now known as International Computer Driving Licence. It is a computer literacy certification often promoted by Italian schools, especially in the first decade of 2000s.
See the descriptions of the single levels at https://europass.cedefop.europa.eu/resources/digital-competences (last consulted on 07/09/2019). The names of the areas vary from the DigiComp ones and correspond to information processing, communication, content creation, safety, and problem solving.
Questions were categorised according to the five DigComp areas for scoring purposes, although some questions overlap two categories. Question 1, 5, 6, 8, and 12 belong to the “Information and data literacy” area. Questions 9 and 14 belong to the area. Questions 9 and 14 belong to the Communication and collaboration area. Questions 2, 3, and 14 belong to the Digital content creation area. Questions 7, 10, and 11 belong to the Safety area, whereas the Problem solving area only includes question 15. Question 4 was not inserted in any of the previous categories.
Here, the second-level domain can be translated in English as ‘freemusic’.
ANSA is the leading Italian wire service.
Corriere della Sera is a well-known Italian daily newspaper.
Treccani is a renowned Italian encyclopaedia.
A detailed study on Italian fake news can be found in .
The answer collection system encrypted the respondents’ IPs using a hash MD5 algorithm.
An overview can be found in . See also ; ; .
For a more comprehensive study on Italian university students and safety, see . The study concluded that there is an erroneous perception of the level of IT security knowledge, even amongst respondents studying technical subjects.
See footnote for more details on how questions were categorised.
The graphs show the minimum and maximum score that could be reached in the five areas and the percentage of respondents for each score.